
Back to Dashboard 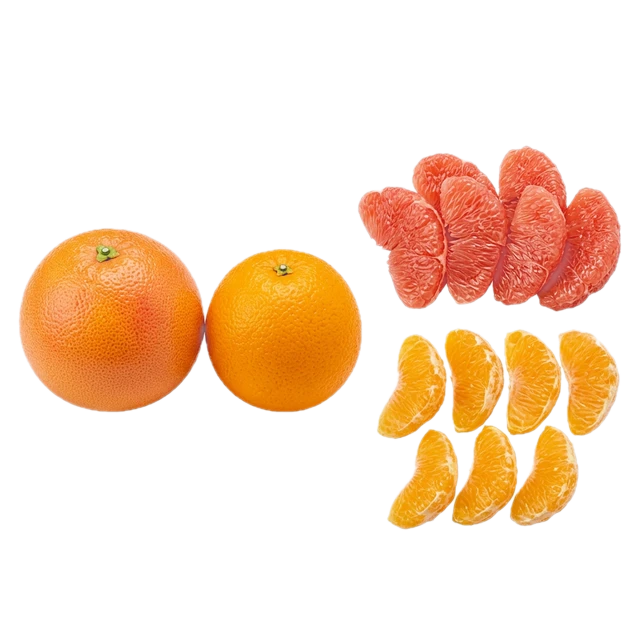
Category Analysis ID: 2000
Fruit
Detailed breakdown of health metrics and processing levels for 242 food items in this category.
Food Compass 2.0
A holistic nutrient profiling system (0-100) that assesses food healthfulness across 9 domains. Higher is better.
Food Compass 2.0
70.5AVG
0102030405060708090100
Score Interpretation
0-30 Limit consumption3.3%
31-70 Moderate consumption44.2%
71-100 Recommended consumption52.5%
Health Star Rating
Australian/NZ system rating the overall nutritional profile of packaged foods from 0.5 to 5 stars.
Health Star Rating
3.9AVG
012345
Rating Guide
3.5-5.0 Healthier choice, prioritize when comparing products80.2%
2.5-3.0 Moderate choice, acceptable for some categories18.6%
0.5-2.0 Consume occasionally, high in saturated fat, sodium or sugar 1.2%
NOVA Group
Categorizes foods by the extent and purpose of industrial processing (1-4). Lower groups are minimally processed.
NOVA Group
2.0 AVG
1
2
3
4
Group Definitions
Group 1 Unprocessed or minimally processed foods49.6%
Group 2 Processed culinary ingredients5.4%
Group 3 Processed foods38.0%
Group 4Ultra-processed foods7.0%
Nutri-Score
European 5-color label system from A (best nutritional quality) to E (poorest nutritional quality).
Nutri Score
A
B
C
D
Grade Definitions
A Highest quality, recommended daily choice53.7%
B Good quality, recommended13.6%
C Moderate quality, consume moderately25.6%
D Lower quality, limit intake6.6%
E Lowest quality, consume sparingly0.4%
Food Items 242
Fruit61104010
Grapefruit and orange sections, raw
Food Compass 2 100
Health Star 5
Nutri-Score A
A
B
C
D
E
NOVA Group 1
1
2
3
4
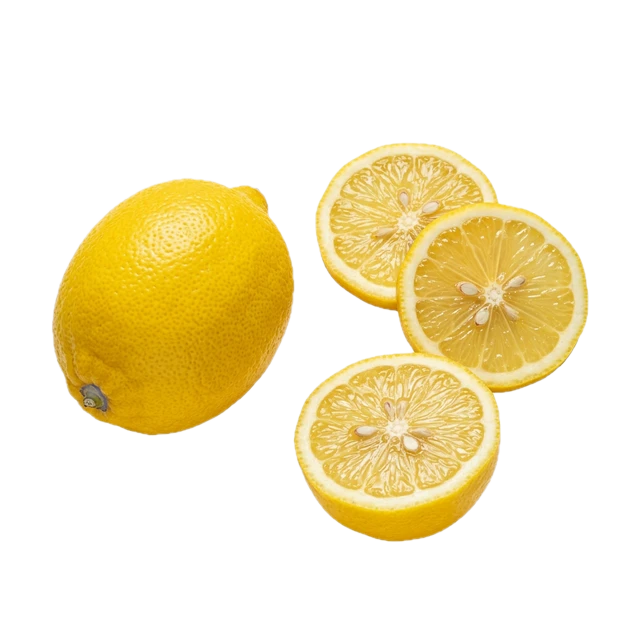
Fruit61113010
Lemon, raw
Food Compass 2 100
Health Star 5
Nutri-Score A
A
B
C
D
E
NOVA Group 1
1
2
3
4
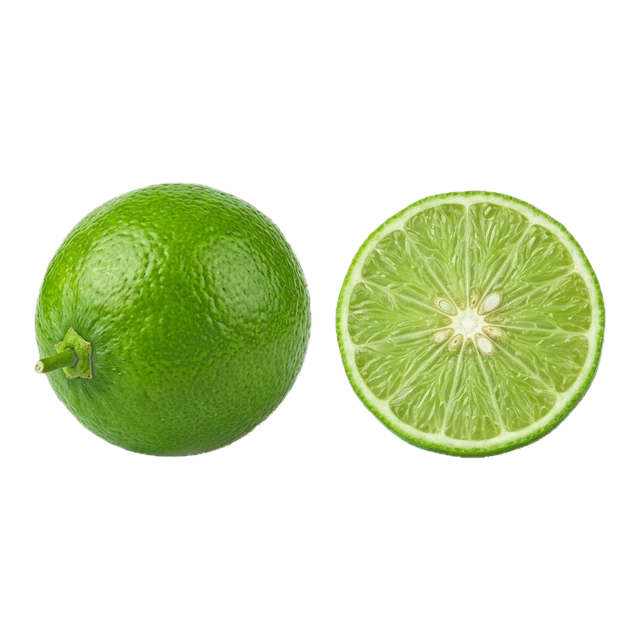
Fruit61116010
Lime, raw
Food Compass 2 100
Health Star 5
Nutri-Score A
A
B
C
D
E
NOVA Group 1
1
2
3
4
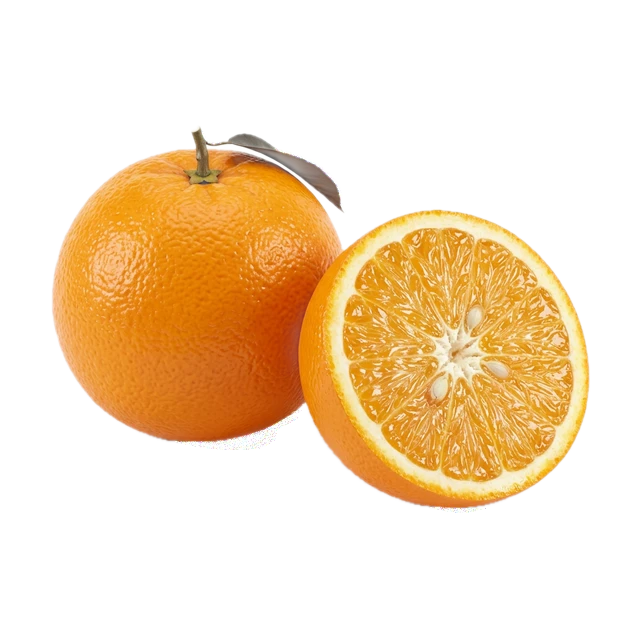
Fruit61119010
Orange, raw
Food Compass 2 100
Health Star 5
Nutri-Score A
A
B
C
D
E
NOVA Group 1
1
2
3
4
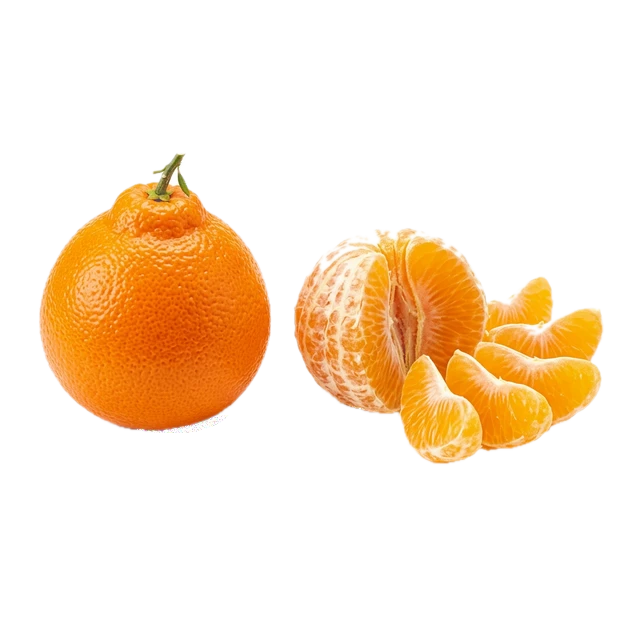
Fruit61125000
Tangelo, raw
Food Compass 2 100
Health Star 5
Nutri-Score A
A
B
C
D
E
NOVA Group 1
1
2
3
4
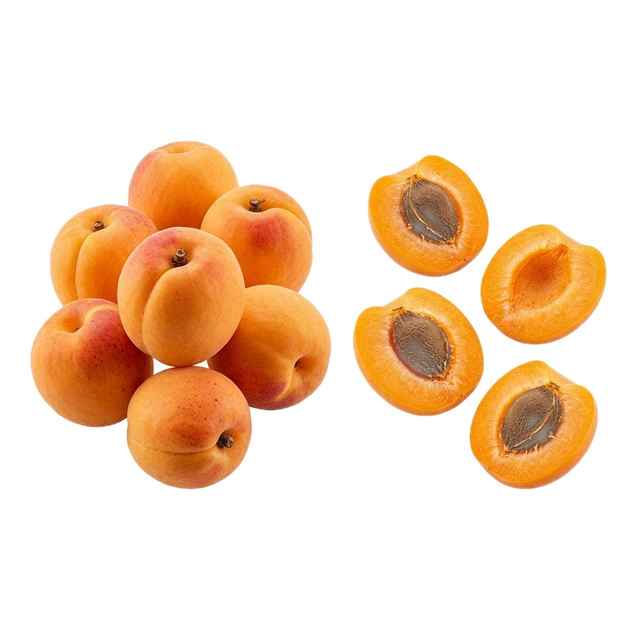
Fruit63103010
Apricot, raw
Food Compass 2 100
Health Star 5
Nutri-Score A
A
B
C
D
E
NOVA Group 1
1
2
3
4
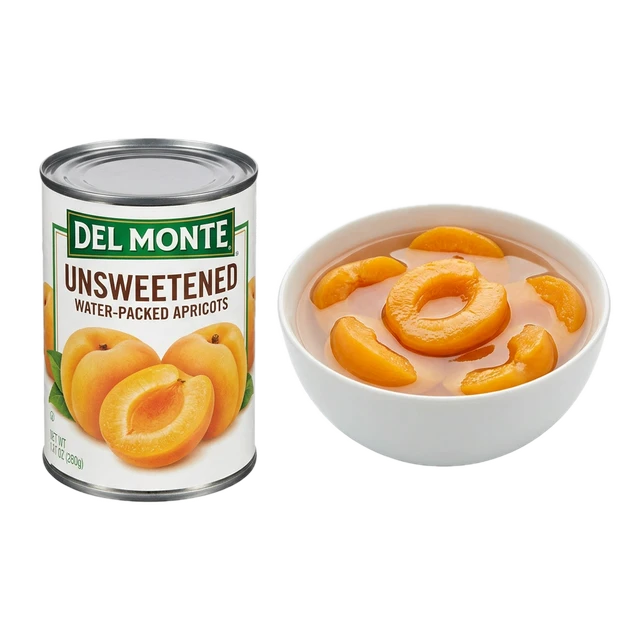
Fruit63103120
Apricot, cooked or canned, unsweetened, water pack
Food Compass 2 100
Health Star 5
Nutri-Score A
A
B
C
D
E
NOVA Group 1
1
2
3
4
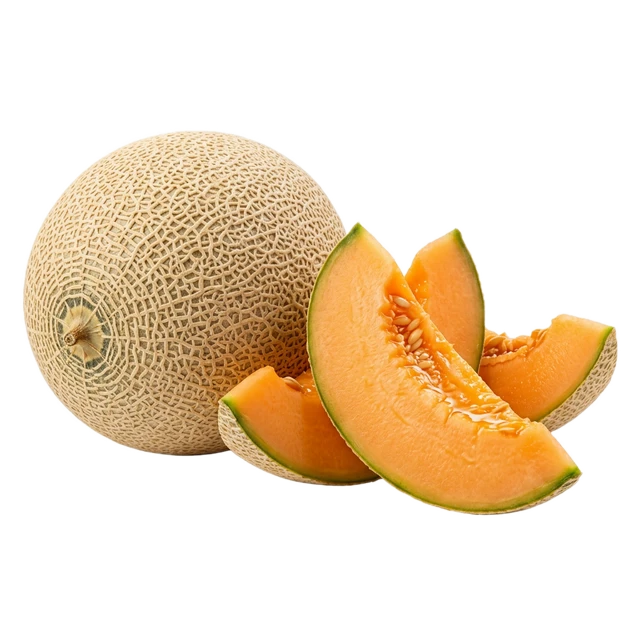
Fruit63109010
Cantaloupe, raw
Food Compass 2 100
Health Star 5
Nutri-Score A
A
B
C
D
E
NOVA Group 1
1
2
3
4
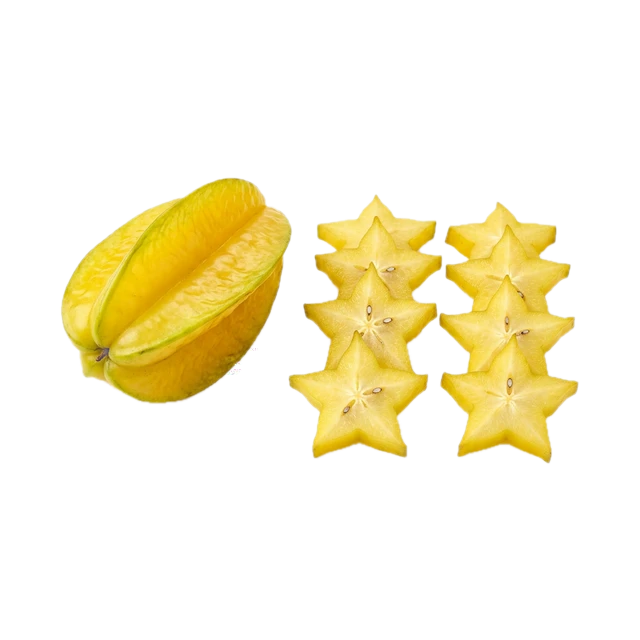
Fruit63109700
Starfruit, raw
Food Compass 2 100
Health Star 5
Nutri-Score A
A
B
C
D
E
NOVA Group 1
1
2
3
4
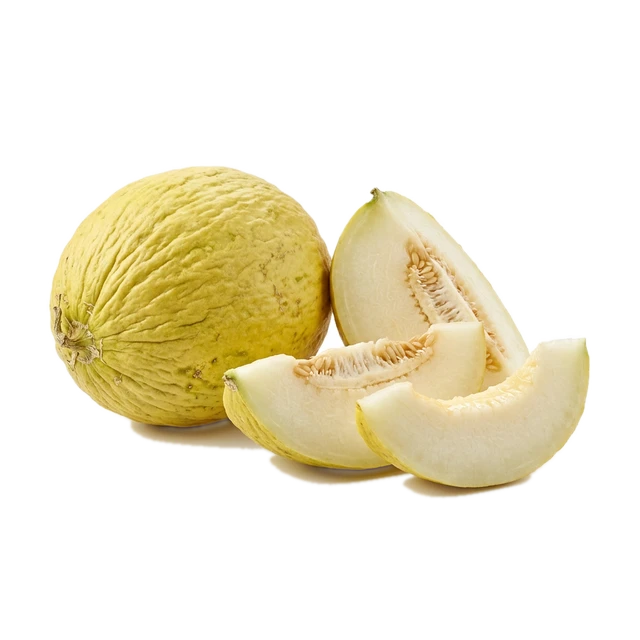
Fruit63110010
Cassaba melon, raw
Food Compass 2 100
Health Star 5
Nutri-Score A
A
B
C
D
E
NOVA Group 1
1
2
3
4
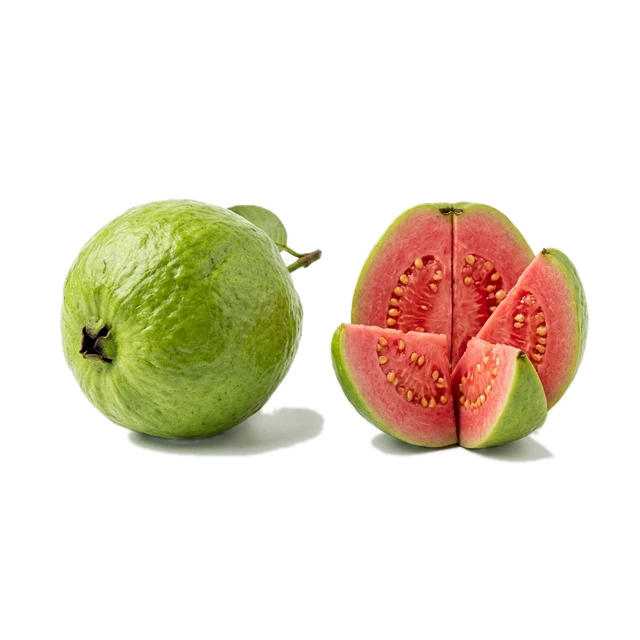
Fruit63125010
Guava, raw
Food Compass 2 100
Health Star 5
Nutri-Score A
A
B
C
D
E
NOVA Group 1
1
2
3
4
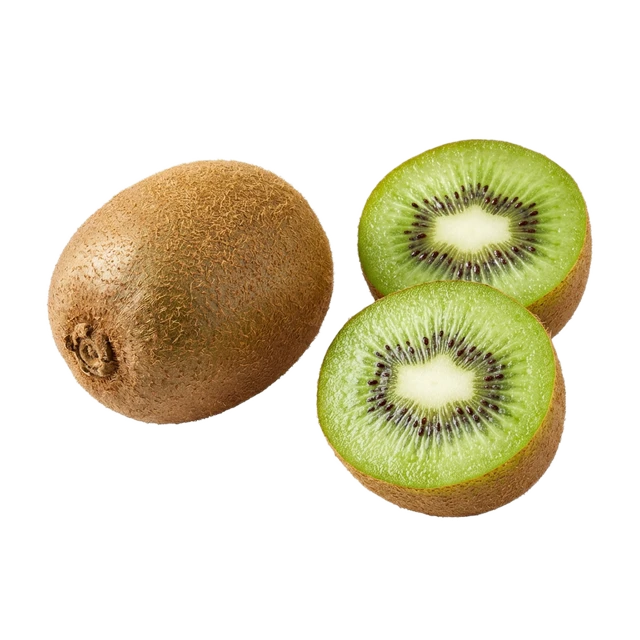
Fruit63126500
Kiwi fruit, raw
Food Compass 2 100
Health Star 5
Nutri-Score A
A
B
C
D
E
NOVA Group 1
1
2
3
4
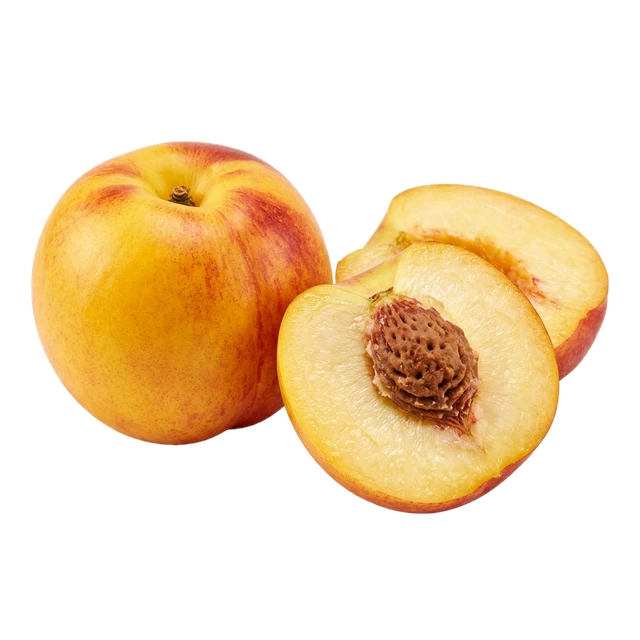
Fruit63131010
Nectarine, raw
Food Compass 2 100
Health Star 5
Nutri-Score A
A
B
C
D
E
NOVA Group 1
1
2
3
4
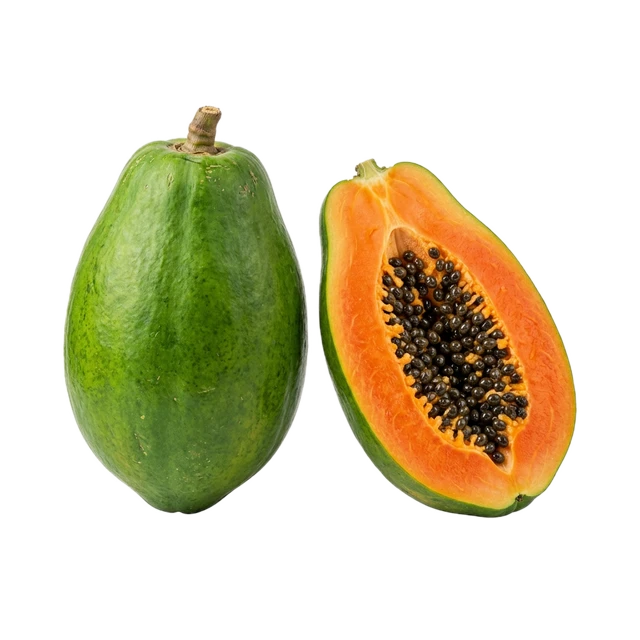
Fruit63133010
Papaya, raw
Food Compass 2 100
Health Star 5
Nutri-Score A
A
B
C
D
E
NOVA Group 1
1
2
3
4
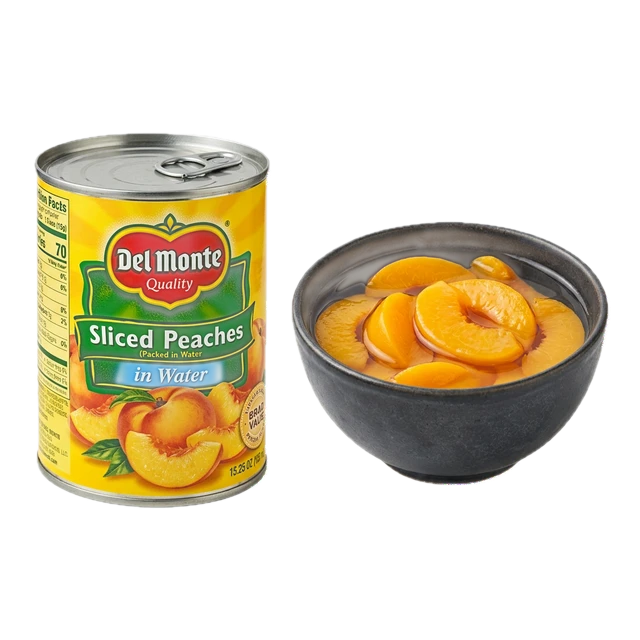
Fruit63135120
Peach, cooked or canned, unsweetened, water pack
Food Compass 2 100
Health Star 5
Nutri-Score A
A
B
C
D
E
NOVA Group 1
1
2
3
4
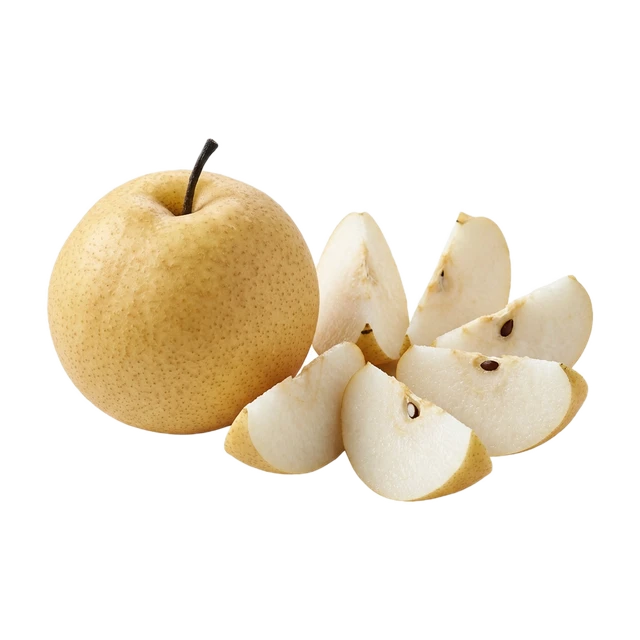
Fruit63137050
Pear, Asian, raw
Food Compass 2 100
Health Star 5
Nutri-Score A
A
B
C
D
E
NOVA Group 1
1
2
3
4
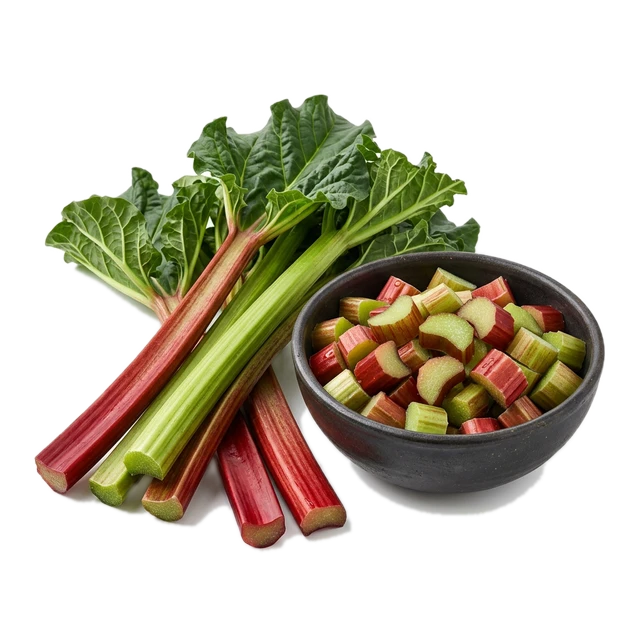
Fruit63147010
Rhubarb, raw
Food Compass 2 100
Health Star 5
Nutri-Score A
A
B
C
D
E
NOVA Group 1
1
2
3
4
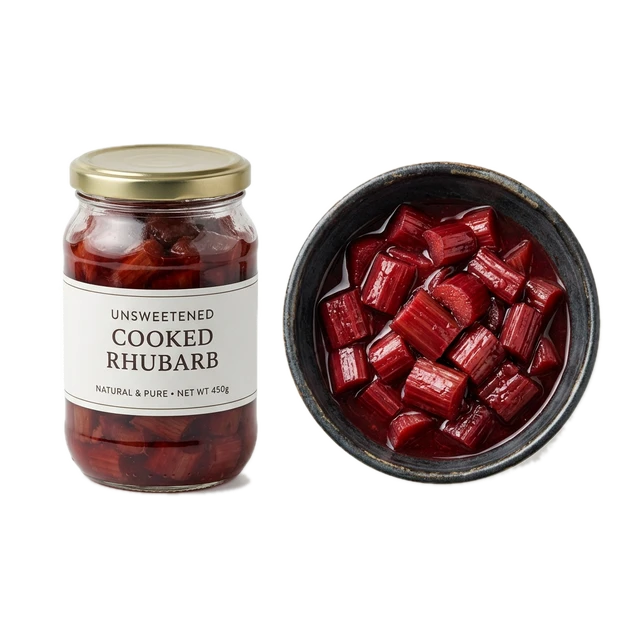
Fruit63147120
Rhubarb, cooked or canned, unsweetened
Food Compass 2 100
Health Star 5
Nutri-Score A
A
B
C
D
E
NOVA Group 1
1
2
3
4
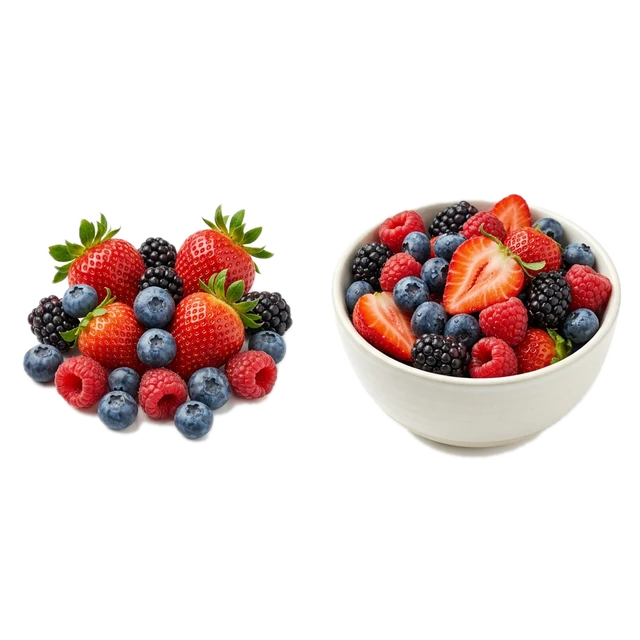
Fruit63200100
Berries, NFS
Food Compass 2 100
Health Star 4.5
Nutri-Score A
A
B
C
D
E
NOVA Group 1
1
2
3
4
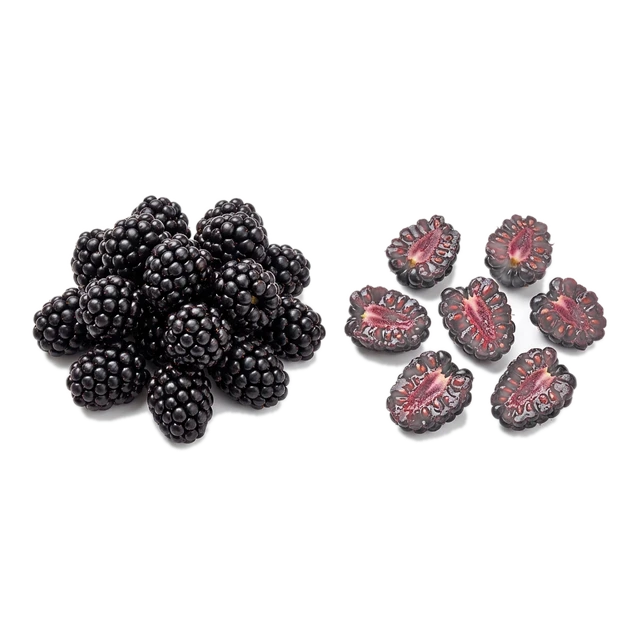
Fruit63201010
Blackberries, raw
Food Compass 2 100
Health Star 5
Nutri-Score A
A
B
C
D
E
NOVA Group 1
1
2
3
4
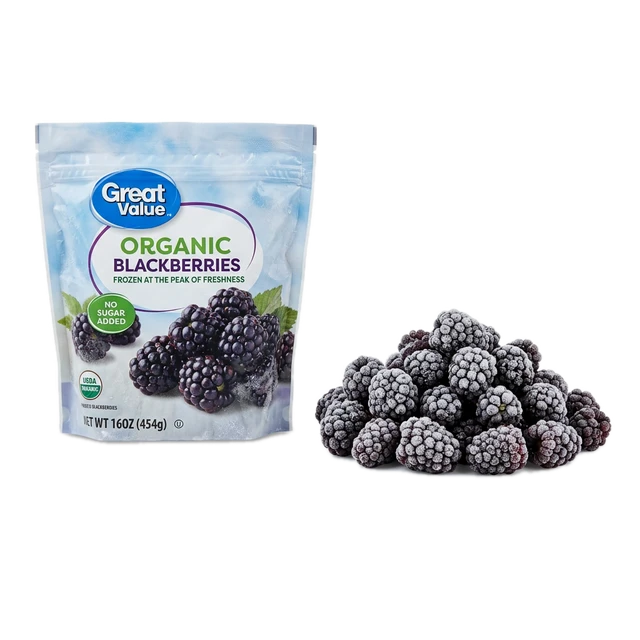
Fruit63201600
Blackberries, frozen
Food Compass 2 100
Health Star 5
Nutri-Score A
A
B
C
D
E
NOVA Group 1
1
2
3
4
Fruit63205010
Boysenberries, raw
Food Compass 2 100
Health Star 5
Nutri-Score A
A
B
C
D
E
NOVA Group 1
1
2
3
4
Fruit63205600
Boysenberries, frozen
Food Compass 2 100
Health Star 5
Nutri-Score A
A
B
C
D
E
NOVA Group 1
1
2
3
4
Fruit63207010
Cranberries, raw
Food Compass 2 100
Health Star 5
Nutri-Score A
A
B
C
D
E
NOVA Group 1
1
2
3
4
Fruit63215010
Loganberries, raw
Food Compass 2 100
Health Star 5
Nutri-Score A
A
B
C
D
E
NOVA Group 1
1
2
3
4
Fruit63217010
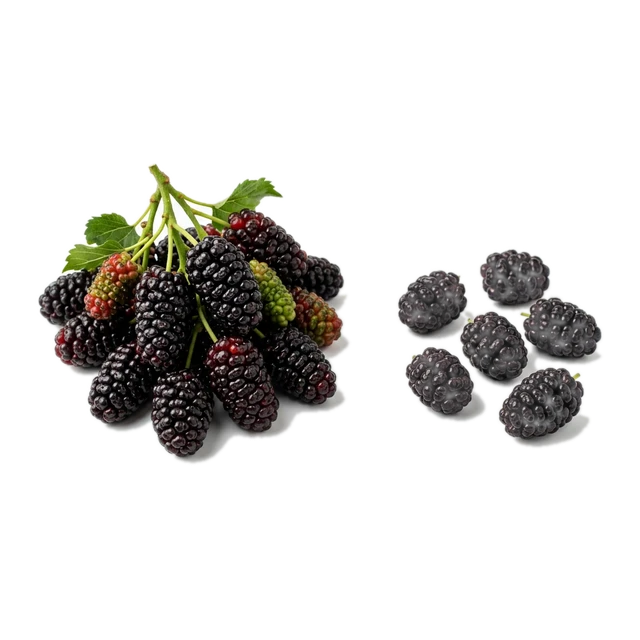
Mulberries, raw
Food Compass 2 100
Health Star 5
Nutri-Score A
A
B
C
D
E
NOVA Group 1
1
2
3
4
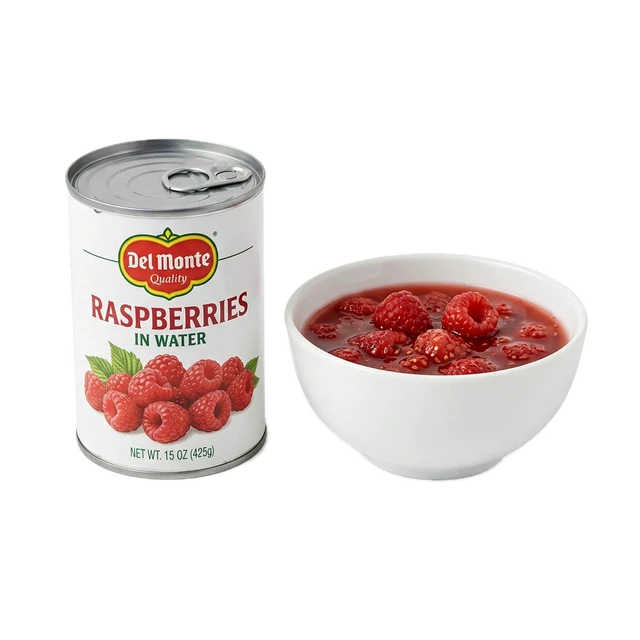
Fruit63219000
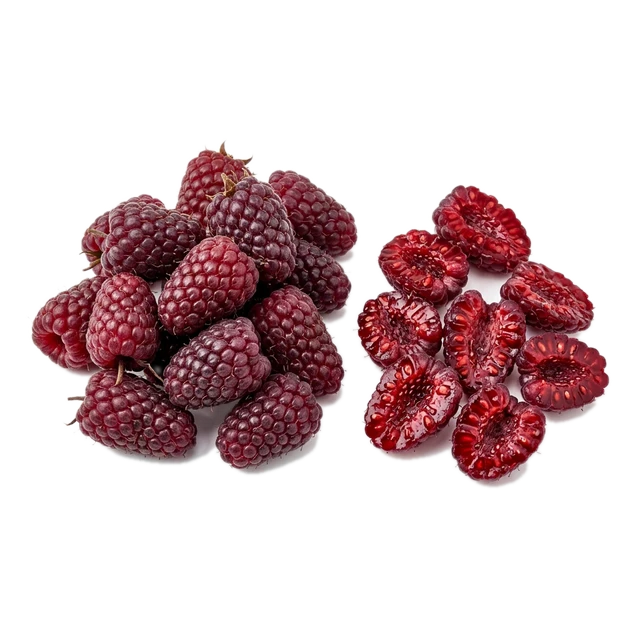
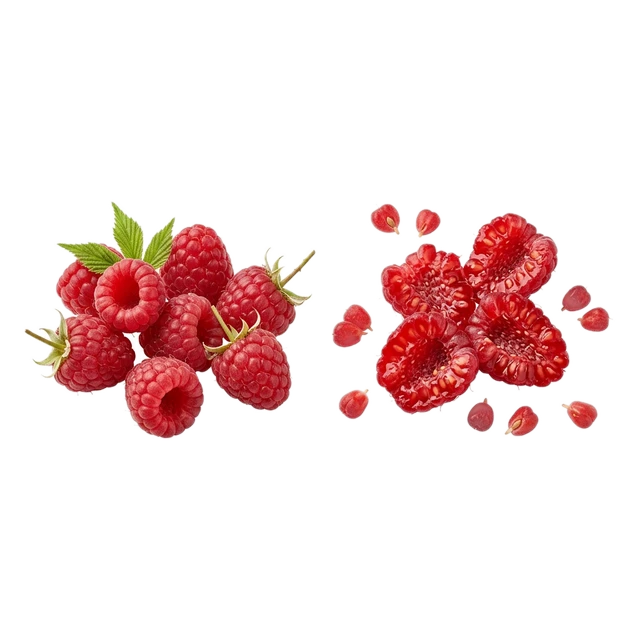
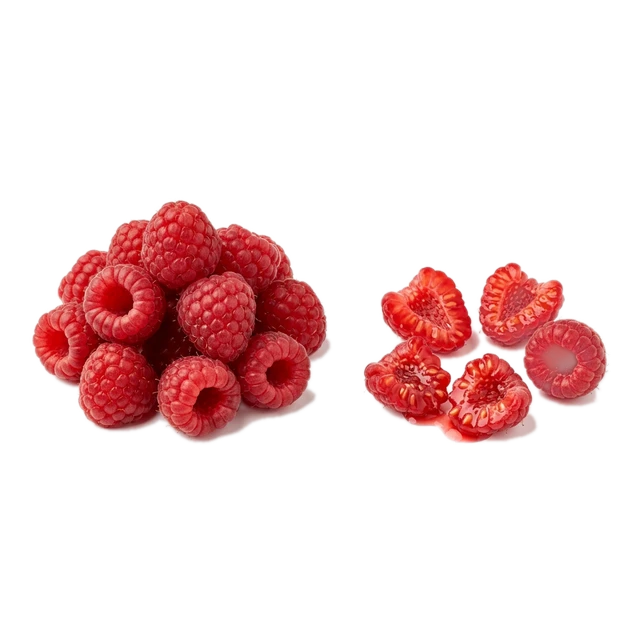
Raspberries, raw
Food Compass 2 100
Health Star 5
Nutri-Score A
A
B
C
D
E
NOVA Group 1
1
2
3
4
Fruit63219020
Raspberries, red, raw
Food Compass 2 100
Health Star 5
Nutri-Score A
A
B
C
D
E
NOVA Group 1
1
2
3
4
Fruit63219120
Raspberries, cooked or canned, unsweetened, water pack
Food Compass 2 100
Health Star 5
Nutri-Score A
A
B
C
D
E
NOVA Group 1
1
2
3
4
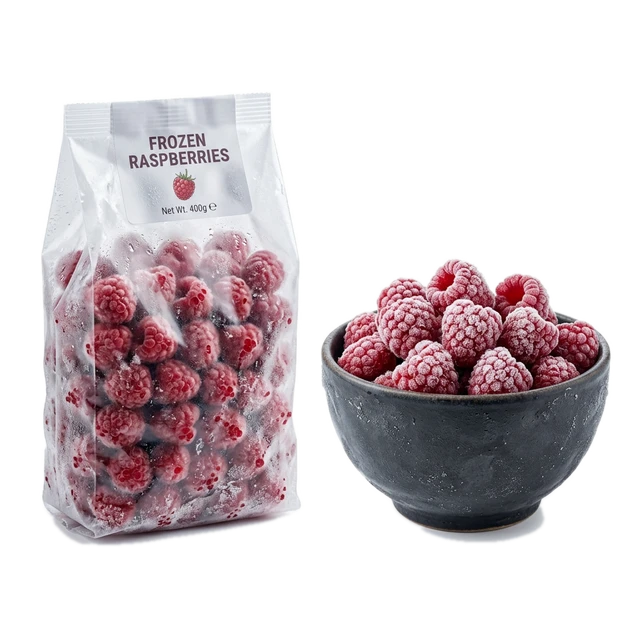
Fruit63219610
Raspberries, frozen
Food Compass 2 100
Health Star 5
Nutri-Score A
A
B
C
D
E
NOVA Group 1
1
2
3
4
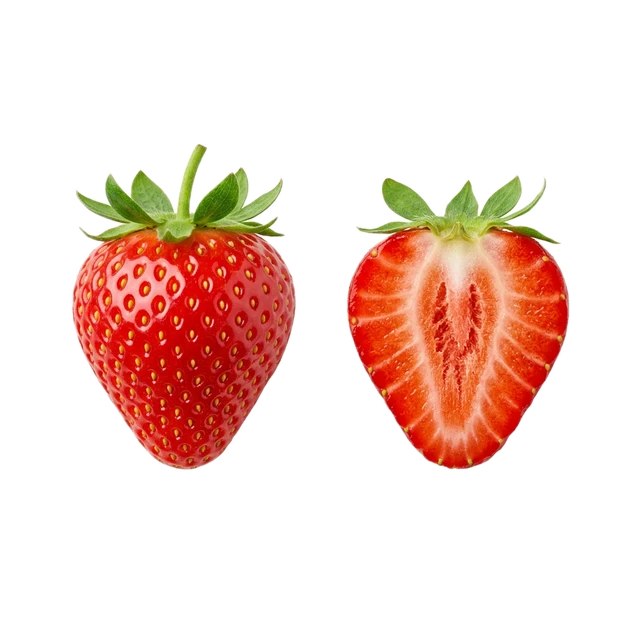
Fruit63223020
Strawberries, raw
Food Compass 2 100
Health Star 5
Nutri-Score A
A
B
C
D
E
NOVA Group 1
1
2
3
4
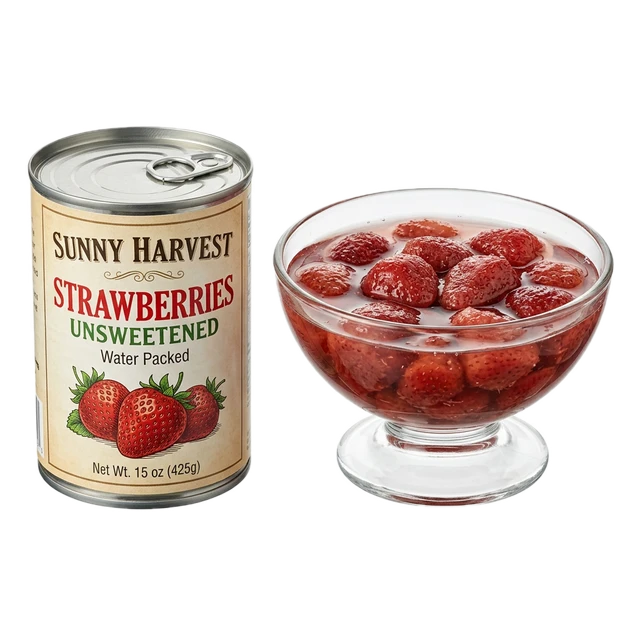
Fruit63223120
Strawberries, cooked or canned, unsweetened, water pack
Food Compass 2 100
Health Star 5
Nutri-Score A
A
B
C
D
E
NOVA Group 1
1
2
3
4
Fruit63223610
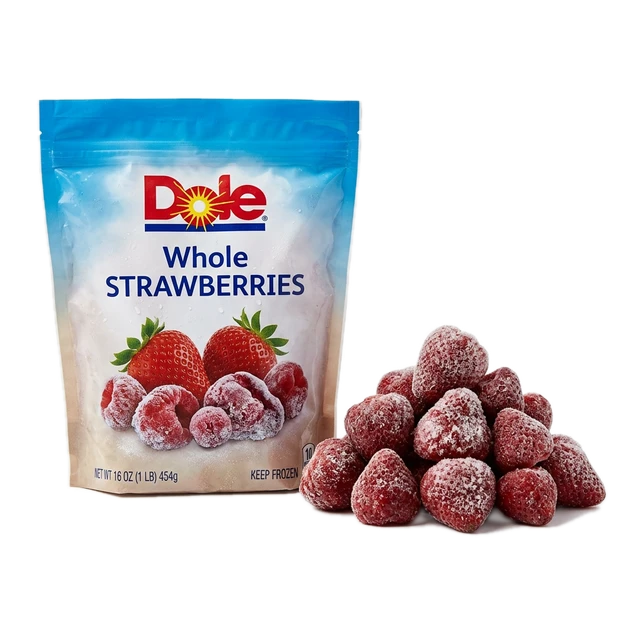
Strawberries, frozen
Food Compass 2 100
Health Star 4.5
Nutri-Score A
A
B
C
D
E
NOVA Group 1
1
2
3
4
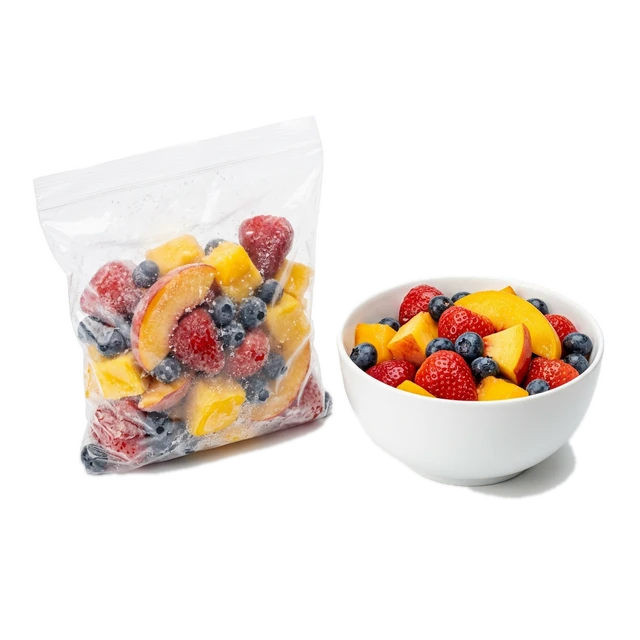
Fruit63311180
Fruit mixture, frozen
Food Compass 2 100
Health Star 4
Nutri-Score A
A
B
C
D
E
NOVA Group 1
1
2
3
4
Fruit61101010
Grapefruit, raw
Food Compass 2 99
Health Star 5
Nutri-Score A
A
B
C
D
E
NOVA Group 1
1
2
3
4
Fruit61122350
Orange, mandarin, canned or frozen, drained
Food Compass 2 99
Health Star 4
Nutri-Score A
A
B
C
D
E
NOVA Group 3
1
2
3
4