
Jumbo Breaded Butterfly Shrimp
Health
Nutrition
Nutri-Score
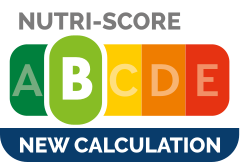 Good nutritional quality
Nutri-Score data warning
Nutrient levels
Fat in moderate quantity (11.8%)
Saturated fat in moderate quantity (2.35%)
Sugars in low quantity (1.18%)
Salt in moderate quantity (0.874%)
Nutrition facts
| Nutrition facts | As sold for 100 g / 100 ml | Compared to: Jumbo shrimps |
|---|---|---|
| Energy | 1013 kcal (242 kcal) | 309.722 kJ (73 kcal) |
| Fat | 11.76 g | 0.418 g (+2713%) |
| Saturated fat | 2.35 g | 0.169 g (+1291%) |
| Trans fat | 0 g | ? |
| Cholesterol | 0.176 mg | ? |
| Carbohydrates | 11.76 g | 0.312 g (+3669%) |
| Sugars | 1.18 g | 0.165 g (+615%) |
| Dietary fiber | 0 g | ? |
| Proteins | 21.18 g | 16.381 g (+29%) |
| Salt | 0.87376 g | 0.817 g (+7%) |
| Sodium | 0.349504 g | 0.327 g (+7%) |
| Vitamin A | 0.0000528 IU | ? |
| Vitamin C | 0.0014 mg | ? |
| Calcium | 0.071 mg | ? |
| Iron | 0.00127 mg | ? |
| Fruits, vegetables and legumes | ? | ? |
Nutrition facts (Detailed data)
| Nutrition facts | As sold for 100 g / 100 ml | As sold Per serving (legacy) |
|---|---|---|
| Energy | 1013 kcal (242 kcal) | 862 kcal (206 kcal) |
| Fat | 11.76 g | 10 g |
| Saturated fat | 2.35 g | 2 g |
| Trans fat | 0 g | 0 g |
| Cholesterol | 0.176 mg | 0.15 mg |
| Carbohydrates | 11.76 g | 10 g |
| Sugars | 1.18 g | 1 g |
| Dietary fiber | 0 g | 0 g |
| Proteins | 21.18 g | 18 g |
| Salt | 0.87376 g | 0.743 g |
| Sodium | 0.349504 g | 0.297 g |
| Vitamin A | 0.0000528 IU | 0.0000449 IU |
| Vitamin C | 0.0014 mg | 0.00119 mg |
| Calcium | 0.071 mg | 0.0604 mg |
| Iron | 0.00127 mg | 0.00108 mg |
| Fruits, vegetables and legumes | ? | ? |
Serving size
Ingredients
Ingredients list
Ingredient information
Added sugars
Allergens
Ingredients analysis
No ingredients containing palm oil.
Unrecognized: en:farm-raised-shrimp
Vegan status unknown
Unrecognized: en:farm-raised-shrimp
Vegetarian status unknown
Unrecognized: en:farm-raised-shrimp
Food Processing
NOVA group
 Ultra-processed food and drink products
Elements that indicate the product is in NOVA group 4
How NOVA works
Additives
E330 - Citric acidAntioxidantSequestrant
Citric acid is a natural organic acid found in citrus fruits such as lemons, oranges, and limes.
It is widely used in the food industry as a flavor enhancer, acidulant, and preservative due to its tart and refreshing taste.
Citric acid is safe for consumption when used in moderation and is considered a generally recognized as safe (GRAS) food additive by regulatory agencies worldwide.
E412 - Guar gumEmulsifierStabiliserThickener
Guar gum (E412) is a natural food additive derived from guar beans.
This white, odorless powder is valued for its remarkable thickening and stabilizing properties, making it a common ingredient in various food products, including sauces, dressings, and ice creams.
When used in moderation, guar gum is considered safe for consumption, with no known adverse health effects.
E500 - Sodium carbonatesStabiliserThickener
Sodium carbonates (E500) are compounds commonly used in food preparation as leavening agents, helping baked goods rise by releasing carbon dioxide when they interact with acids.
Often found in baking soda, they regulate the pH of food, preventing it from becoming too acidic or too alkaline. In the culinary world, sodium carbonates can also enhance the texture and structure of foods, such as noodles, by modifying the gluten network.
Generally recognized as safe, sodium carbonates are non-toxic when consumed in typical amounts found in food.
E500ii - Sodium hydrogen carbonateStabiliserThickener
Sodium hydrogen carbonate, also known as E500ii, is a food additive commonly used as a leavening agent.
When added to recipes, it releases carbon dioxide gas upon exposure to heat or acids, causing dough to rise and resulting in a light, fluffy texture in baked goods.
It is generally recognized as safe (GRAS) by regulatory authorities when used in appropriate quantities and poses no significant health risks when consumed in typical food applications.
E541 - Sodium aluminium phosphateEmulsifierStabiliserThickener
Sodium aluminium phosphate (SAlP) describes the inorganic compounds consisting of sodium salts of aluminium phosphates. The most common SAlP has the formulas NaH14Al3(PO4)8·4H2O and Na3H15Al2(PO4)8. These materials are prepared by combining alumina, phosphoric acid, and sodium hydroxide.In addition to the usual hydrate, an anhydrous SAlP is also known, Na3H15Al2(PO4)8 (CAS#10279-59-1), referred to as 8:2:3, reflecting the ratio of phosphate to aluminium to sodium. Additionally an SAlP of ill-defined stoichiometry is used (NaxAly(PO4)z (CAS# 7785-88-8).The acidic sodium aluminium phosphates are used as acids for baking powders for the chemical leavening of baked goods. Upon heating, SAlP combines with the baking soda to give carbon dioxide. Most of its action occurs at baking temperatures, rather than when the dough or batter is mixed at room temperature. SAlPs are advantageous because they impart a neutral flavor. As a food additive, it has the E number E541. Basic sodium aluminium phosphates are also known, e.g., Na15Al3(PO4)8. These species are useful in cheese making.
Environment
Green-Score, origins bonus, and transportation impact are shown for Worldwide .
Green Score
Overall grade
 Very high environmental impact
About Green-Score
Current scope
Life cycle analysis
Average impact of the category
Norway lobster, raw • Score: 0/100Life-cycle reference
Overall environmental impact by stage (PEF)
The overall environmental impact figure (PEF) comes from ADEME's Agribalyse database, for the category: Norway lobster, raw. Source: ADEME Agribalyse Database.
| Stage | Impact |
|---|---|
| Agriculture | 81.4 % |
| Processing | 0.9 % |
| Packaging | 1.1 % |
| Transportation | 15.5 % |
| Distribution | 0.6 % |
| Consumption | 0.6 % |
Bonuses and maluses
Declared origins
Packaging impact
Green-Score for this product
Green-Score for this product
Final score: 0/100Final score breakdown
Carbon footprint
Carbon footprint
Climate impact by stage (CO2e)
The carbon emission figure comes from ADEME's Agribalyse database, for the category: Norway lobster, raw. Source: ADEME Agribalyse Database.
| Stage | Impact |
|---|---|
| Agriculture | 62.7 % |
| Processing | 0.5 % |
| Packaging | 2.5 % |
| Transportation | 32.2 % |
| Distribution | 0.3 % |
| Consumption | 1.7 % |
Packaging
Packaging impact
Data precision
Transportation
Declared origins
Data Source
Product data comes from Open Food Facts. Food Benchmark also adds translations, category comparisons and explanatory calculations.
The database is licensed under ODbL 1.0, individual contents under DbCL 1.0, and product photos under CC BY-SA 3.0.
Product added on March 9, 2017 at 9:36:49 AM UTC by usda-ndb-import .
Last edit on July 12, 2019 at 6:06:34 AM UTC by clockwerx .
Product page also edited by clockwerx, usda-ndb-import.
Source List