
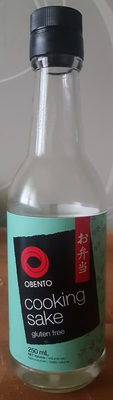
Cooking sake
Labels
 Not computed
 Not computed
 Moderate environmental impact
Health
Nutrition
Nutrition facts
| Nutrition facts | As sold for 100 ml |
|---|---|
| Energy | ~ 76.5 kJ (94 kcal) |
| FAT | 0 g |
| Saturated fat | 0 g |
| Carbohydrates | 4.2 g |
| Sugars | 2.8 g |
| Dietary fiber | ? |
| Proteins | 0.3 g |
| Salt | 1.5 g |
| Sodium | 0.6 g |
| Minerals | |
| Fruits, vegetables and legumes | ? |
Nutrition facts (Detailed data)
| Nutrition facts | As sold for 100 ml | As sold Per 100 ml (packaging) |
|---|---|---|
| Energy | ~ 76.5 kJ (94 kcal) | ? (94 kcal) |
| FAT | 0 g | 0 g |
| Saturated fat | 0 g | 0 g |
| Carbohydrates | 4.2 g | 4.2 g |
| Sugars | 2.8 g | 2.8 g |
| Dietary fiber | ? | ? |
| Proteins | 0.3 g | 0.3 g |
| Salt | 1.5 g | 1.5 g |
| Sodium | 0.6 g | 0.6 g |
| Minerals | ||
| Fruits, vegetables and legumes | ? | ? |
Estimated Activity Time
Approximate time needed to burn the energy in 100 g / 100 ml: 77 kJ. Reference adult weight: 70 kg. Energy density: Low.
Ingredients
Ingredients image

Ingredients analysis
Palm oil content unknown
Vegan status unknown
Vegetarian status unknown
Food Processing
NOVA group
How NOVA works
Additives
Environment
Green-Score, origins bonus, and transportation impact are shown for Worldwide .
Green Score
Overall grade
Moderate environmental impactAbout Green-Score
Current scope
Life cycle analysis
Average impact of the category
Sake or rice wine • Score: 58/100Life-cycle reference
Overall environmental impact by stage (PEF)
The overall environmental impact figure (PEF) comes from ADEME's Agribalyse database, for the category: Sake or rice wine. Source: ADEME Agribalyse Database.
| Stage | Impact |
|---|---|
| Agriculture | 0.8 % |
| Processing | 37.6 % |
| Packaging | 41.8 % |
| Transportation | 14.1 % |
| Distribution | 3.7 % |
| Consumption | 2.2 % |
Bonuses and maluses
Declared origins
Packaging impact
Green-Score for this product
Green-Score for this product
Final score: 51/100Final score breakdown
Carbon footprint
Carbon footprint
Climate impact by stage (CO2e)
The carbon emission figure comes from ADEME's Agribalyse database, for the category: Sake or rice wine. Source: ADEME Agribalyse Database.
| Stage | Impact |
|---|---|
| Agriculture | 0.5 % |
| Processing | 30.1 % |
| Packaging | 50.2 % |
| Transportation | 17.4 % |
| Distribution | 1.2 % |
| Consumption | 0.5 % |
Packaging
Packaging impact
Packaging materials
| Material | % | Packaging weight | Packaging weight per 100 g of product |
|---|---|---|---|
| Glass | |||
| Total |
Transportation
Declared origins
Data Source
Data presented on this page is sourced from the Open Food Facts database. This platform does not alter the original dataset; its purpose is solely to enhance data visualization and user accessibility.
Product added on May 27, 2018 at 6:15:10 PM UTC by kiliweb .
Last edit on March 17, 2026 at 11:03:00 PM UTC by new-nutrition-bot .
Product page also edited by archanox, clockwerx, kiliweb, laura-chaud, municorn-calorie-counter-app, new-nutrition-bot, openfoodfacts-contributors, roboto-app, yuka.UTZzSEFxc2kvdjh4dE5vUDBnSHMyOU5PM3NlZ1pFaW9NKzhNSVE9PQ.