

Basilico
Labels
 Very good nutritional quality
 Ultra-processed food and drink products
 Very low environmental impact
Health
Nutrition
Label
Very good nutritional qualityNutrient levels
Fat in low quantity (2.6%)
Saturated fat in low quantity (0.3%)
Sugars in moderate quantity (5.9%)
Salt in moderate quantity (0.89%)
Nutrition label
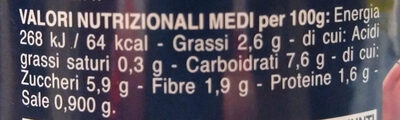
Nutrition facts
| Nutrition facts | As sold for 100 g / 100 ml |
|---|---|
| Energy | 268 kJ (64 kcal) |
| FAT | 2.6 g |
| Saturated fat | 0.3 g |
| Carbohydrates | 7.6 g |
| Sugars | 5.9 g |
| Dietary fiber | 1.9 g |
| Proteins | 1.6 g |
| Salt | 0.89 g |
| Sodium | 0.36 g |
| Minerals | |
| Fruits, vegetables and legumes | ~ 94.19 % |
Nutrition facts (Detailed data)
| Nutrition facts | As sold for 100 g / 100 ml | As sold Per 100 g (packaging) | As sold Per 100 g (estimate) |
|---|---|---|---|
| Energy | 268 kJ (64 kcal) | 268 kJ (64 kcal) | ~ 329.88 kJ (79 kcal) |
| FAT | 2.6 g | 2.6 g | ~ 4.8 g |
| Saturated fat | 0.3 g | 0.3 g | ~ 0.53 g |
| Cholesterol | ~ 0 g | ? | ~ 0 g |
| Carbohydrates | 7.6 g | 7.6 g | ~ 6.19 g |
| Sugars | 5.9 g | 5.9 g | ~ 5.21 g |
| Added sugars | ~ 0.75 g | ? | ~ 0.75 g |
| Sucrose | ~ 0.95 g | ? | ~ 0.95 g |
| Glucose | ~ 2.12 g | ? | ~ 2.12 g |
| Fructose | ~ 2.25 g | ? | ~ 2.25 g |
| Galactose | ~ 0.01 g | ? | ~ 0.01 g |
| Lactose | ~ 0.12 g | ? | ~ 0.12 g |
| Maltose | ~ 0.12 g | ? | ~ 0.12 g |
| Starch | ~ 0.18 g | ? | ~ 0.18 g |
| Polyols | ~ 0.2 g | ? | ~ 0.2 g |
| Dietary fiber | 1.9 g | 1.9 g | ~ 2.06 g |
| Proteins | 1.6 g | 1.6 g | ~ 1.63 g |
| Salt | 0.89 g | 0.89 g | ~ 0.46 g |
| Sodium | 0.36 g | 0.36 g | ~ 0.18 g |
| Alcohol | ~ 0 % vol | ? | ~ 0 % vol |
| Vitamins | |||
| Vitamin A | ~ 0 g | ? | ~ 0 g |
| Beta-carotene | ~ 0 g | ? | ~ 0 g |
| Vitamin D | ~ 0 g | ? | ~ 0 g |
| Vitamin E | ~ 0 g | ? | ~ 0 g |
| Vitamin C | ~ 0.01 g | ? | ~ 0.01 g |
| Vitamin B1 | ~ 0 g | ? | ~ 0 g |
| Vitamin B2 | ~ 0 g | ? | ~ 0 g |
| Vitamin PP | ~ 0 g | ? | ~ 0 g |
| Vitamin B6 | ~ 0 g | ? | ~ 0 g |
| Vitamin B9 | ~ 0 g | ? | ~ 0 g |
| Vitamin B12 | ~ 0 g | ? | ~ 0 g |
| Pantothenic acid | ~ 0 g | ? | ~ 0 g |
| Minerals | |||
| Potassium | ~ 0.35 g | ? | ~ 0.35 g |
| Calcium | ~ 0.03 g | ? | ~ 0.03 g |
| Phosphorus | ~ 0.03 g | ? | ~ 0.03 g |
| Iron | ~ 0 g | ? | ~ 0 g |
| Magnesium | ~ 0.02 g | ? | ~ 0.02 g |
| Zinc | ~ 0 g | ? | ~ 0 g |
| Copper | ~ 0 g | ? | ~ 0 g |
| Manganese | ~ 0 g | ? | ~ 0 g |
| Selenium | ~ 0 g | ? | ~ 0 g |
| Iodine | ~ 0 g | ? | ~ 0 g |
| Fruits, vegetables and legumes | ~ 94.19 % | ? | ~ 94.19 % |
| Phylloquinone | ~ 0 g | ? | ~ 0 g |
| Water | ~ 84.43 g | ? | ~ 84.43 g |
Serving size
Estimated Activity Time
Approximate time needed to burn the energy in 100 g / 100 ml: 268 kJ. Reference adult weight: 70 kg. Energy density: Low.
Ingredients
Ingredients image
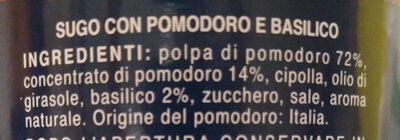
Ingredients list
Ingredient information
Ingredients analysis
No ingredients containing palm oil.
No non-vegan ingredients.
No non-vegetarian ingredients.
Food Processing
NOVA group
Ultra-processed food and drink productsElements that indicate the product is in NOVA group 4
How NOVA works
Additives
Environment
Green-Score, origins bonus, and transportation impact are shown for Worldwide .
Green Score
Overall grade
Very low environmental impactAbout Green-Score
Current scope
Life cycle analysis
Average impact of the category
Tomato sauce, with onions, prepacked • Score: 90/100Life-cycle reference
Overall environmental impact by stage (PEF)
The overall environmental impact figure (PEF) comes from ADEME's Agribalyse database, for the category: Tomato sauce, with onions, prepacked. Source: ADEME Agribalyse Database.
| Stage | Impact |
|---|---|
| Agriculture | 35.9 % |
| Processing | 16.3 % |
| Packaging | 25.9 % |
| Transportation | 13.2 % |
| Distribution | 5.2 % |
| Consumption | 3.5 % |
Bonuses and maluses
Origins of ingredients
Packaging impact
Green-Score for this product
Green-Score for this product
Final score: 90/100Final score breakdown
Carbon footprint
Carbon footprint
Climate impact by stage (CO2e)
The carbon emission figure comes from ADEME's Agribalyse database, for the category: Tomato sauce, with onions, prepacked. Source: ADEME Agribalyse Database.
| Stage | Impact |
|---|---|
| Agriculture | 16.7 % |
| Processing | 11.4 % |
| Packaging | 44.1 % |
| Transportation | 23.0 % |
| Distribution | 3.3 % |
| Consumption | 1.2 % |
Packaging

Packaging impact
Packaging materials
| Material | % | Packaging weight | Packaging weight per 100 g of product |
|---|---|---|---|
| Glass | |||
| Total |
Declared packaging
Data precision
Transportation
Manufacturing locations
Origins of ingredients
Origins breakdown
| Origin | Percent of ingredients | Impact |
|---|---|---|
| Italy | 100 % | Medium |
Data Source
Data presented on this page is sourced from the Open Food Facts database. This platform does not alter the original dataset; its purpose is solely to enhance data visualization and user accessibility.
Product added on October 2, 2017 at 7:43:43 PM UTC by kiliweb .
Last edit on March 17, 2026 at 11:02:45 PM UTC by new-nutrition-bot .
Product page also edited by archanox, charlesnepote, citrullus28, ecoscore-impact-estimator, foodless, inf, kiliweb, macrofactor, new-nutrition-bot, nur, openfoodfacts-contributors, packbot, prepperapp, product-scan-com, risajanda, roboto-app, roto, telperion87.