ProductsNestléNesquik
Nesquik
Barcode 8000550502827
Nestlé, Nesquik

Nesquik

500 g
BARCODE:8000550502827
CATEGORIES:Beverages And Beverages Preparations, Beverages, Breakfasts, Cocoa And Its Products, Hot Beverages, Beverage Preparations, Cocoa And Chocolate Powders, Instant Beverages, Instant Chocolate Powders
LABELS:No Gluten, Green Dot
PACKAGING:Plastica, Vasetto
COUNTRIES:France, Italy, Morocco, Switzerland

Health

Nutrition

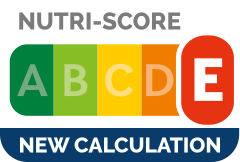
Nutri-Score

ELower nutritional quality

Nutrient levels

Fat in moderate quantity (3.7%)
What you need to know • A high consumption of fat, especially saturated fats, can raise cholesterol, which increases the risk of heart diseases. Recommendation: Limit the consumption of fat and saturated fat • Choose products with lower fat and saturated fat content. Source: National Health Service UK (NHS) - Fat: the facts
Saturated fat in moderate quantity (2.2%)
What you need to know • A high consumption of fat, especially saturated fats, can raise cholesterol, which increases the risk of heart diseases. Recommendation: Limit the consumption of fat and saturated fat • Choose products with lower fat and saturated fat content. Source: National Health Service UK (NHS) - Fat: the facts
Sugars in high quantity (20.1%)
What you need to know • A high consumption of sugar can cause weight gain and tooth decay. It also augments the risk of type 2 diabetes and cardio-vascular diseases. Recommendation: Limit the consumption of sugar and sugary drinks • Sugary drinks (such as sodas, fruit beverages, and fruit juices and nectars) should be limited as much as possible (no more than 1 glass a day). • Choose products with lower sugar content and reduce the consumption of products with added sugars. Source: National Health Service UK (NHS) - Sugar: the facts
Salt in moderate quantity (0.3%)
What you need to know • A high consumption of salt (or sodium) can cause raised blood pressure, which can increase the risk of heart disease and stroke. • Many people who have high blood pressure do not know it, as there are often no symptoms. • Most people consume too much salt (on average 9 to 12 grams per day), around twice the recommended maximum level of intake. Recommendation: Limit the consumption of salt and salted food • Reduce the quantity of salt used when cooking, and don't salt again at the table. • Limit the consumption of salty snacks and choose products with lower salt content. Source: World Health Organization (WHO) - Fact sheet - Salt reduction Source: National Health Service UK (NHS) - Salt: the facts

Nutrition label

Nesquik nutrition label

Nutrition facts

Nutrition factsPrepared for 100 g / 100 mlCompared to: Instant chocolate powders
Energy624 kJ (148 kcal)1,286.636 kJ (307 kcal) (-52%)
Fat3.7 g4.293 g (-14%)
Saturated fat2.2 g2.592 g (-15%)
Carbohydrates20.7 g55.843 g (-63%)
Sugars20.1 g48.363 g (-58%)
Dietary fiber0.9 g?
Proteins7.5 g6.088 g (+23%)
Salt0.3 g0.253 g (+19%)
Sodium0.12 g0.102 g (+18%)
Vitamin D0.0000015 g1.84 µg (-18%)
Vitamin C0.0127 g?
Potassium0.4209 g1,027.673 mg (-59%)
Calcium0.247 g117.126 mg (+111%)
Phosphorus0.2094 g221.333 mg (-5%)
Iron0.0025 g11.697 mg (-79%)
Magnesium0.0592 g145.267 mg (-59%)
Zinc0.0018 g2.34 mg (-23%)
Fruits, vegetables and legumes??

Nutrition facts (Detailed data)

Nutrition factsPrepared for 100 g / 100 mlPrepared Per serving (100 g) (packaging)As sold Per 100 g (packaging)As sold Per serving (100 g) (packaging)As sold Per 100 g (estimate)
Energy624 kJ (148 kcal)624 kJ (148 kcal)? (386 kcal)? (386 kcal)?
Fat3.7 g3.7 g3.6 g3.6 g?
Saturated fat2.2 g2.2 g???
Carbohydrates20.7 g20.7 g78.9 g78.9 g?
Sugars20.1 g20.1 g75 g75.1 g?
Dietary fiber0.9 g0.9 g7.7 g7.7 g?
Proteins7.5 g7.5 g5.1 g5.1 g?
Salt0.3 g0.3 g0.41 g0.001025 g?
Sodium0.12 g0.12 g?0.00041 g?
Vitamin D0.0000015 g0.0000015 g?0.000011 g?
Vitamin C0.0127 g0.0127 g?0.15 g?
Potassium0.4209 g0.4209 g???
Calcium0.247 g0.247 g???
Phosphorus0.2094 g0.2094 g???
Iron0.0025 g0.0025 g???
Magnesium0.0592 g0.0592 g???
Zinc0.0018 g0.0018 g???
Fruits, vegetables and legumes????~ 0 %

Serving size

100 g

Ingredients

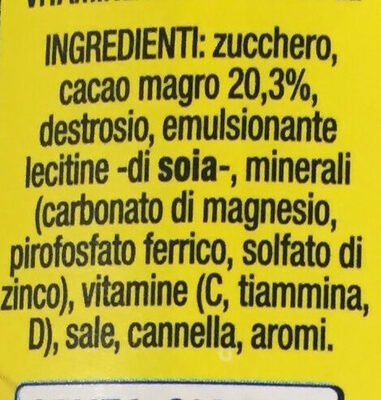
Ingredients image

Nesquik ingredients image

Ingredients list

sugar, lean cocoa 20,3%, dyxsis, soy lecithin emulsifier, magnesium carbonate, ferric pyrophosphate, zinc sulfate, vitamin c, thiamine, vitamin d, salt, cinnamon, aromas,

Ingredient information

Sugar
50% (estimate)
Fat Reduced Cocoa
20.3%
Dyxsis
10.15% (estimate)
Soy Lecithin Emulsifier
9.77% (estimate)
E504i
4.89% (estimate)
Ferric Diphosphate
2.44% (estimate)
Zinc Sulfate
1.22% (estimate)
Vitamins
0.61% (estimate)
Vitamin C
0.31% (estimate)
Thiamin
0.15% (estimate)
Vitamin D
0.08% (estimate)
Salt
0.04% (estimate)
Cinnamon
0.02% (estimate)
Flavouring
0.02% (estimate)

Added sugars

Contains added sugars (~ 54%) Added sugars: sugar Estimated quantity of added sugars in ingredients: 54%

Ingredients analysis

Palm oil free
Yes

No ingredients containing palm oil.

Unrecognized: en:dyxsis, en:soy-lecithin-emulsifier

Vegan
Unknown

Vegan status unknown

Unrecognized: en:dyxsis, en:soy-lecithin-emulsifier

Vegetarian
Unknown

Vegetarian status unknown

Unrecognized: en:dyxsis, en:soy-lecithin-emulsifier


Food Processing

NOVA group

4Ultra-processed food and drink products

Elements that indicate the product is in NOVA group 4

Ingredients
Flavouring

How NOVA works

The NOVA classification assigns food products into 4 groups based on their degree of processing: 1. Unprocessed or minimally processed foods 2. Processed culinary ingredients 3. Processed foods 4. Ultra-processed food and drink products

Additives

No additives detected or data is missing.

Environment

Green-Score, origins bonus, and transportation impact are shown for Worldwide .

Green Score

Overall grade

DHigh environmental impact

About Green-Score

The Green-Score is an experimental score that summarizes the environmental impacts of food products.

Current scope

The Green-Score was initially developed for France and it is being extended to other European countries. The Green-Score formula is subject to change as it is regularly improved to make it more precise and better suited to each country. Select a country to include the full impact of transportation in the final score.

Life cycle analysis

Average impact of the category

CInstant cocoa or chocolate beverage, with sugar, ready-to-drink (reconstituted with standard semi-skimmed milk) • Score: 55/100

Life-cycle reference

Category: Instant cocoa or chocolate beverage, with sugar, ready-to-drink (reconstituted with standard semi-skimmed milk) PEF environmental score: 0.13 Climate change impact: 1.40 kg CO2 eq / kg product The overall environmental impact figure (PEF) comes from ADEME's Agribalyse database, for the category: Instant cocoa or chocolate beverage, with sugar, ready-to-drink (reconstituted with standard semi-skimmed milk). Source: ADEME Agribalyse Database.

Overall environmental impact by stage (PEF)

The overall environmental impact figure (PEF) comes from ADEME's Agribalyse database, for the category: Instant cocoa or chocolate beverage, with sugar, ready-to-drink (reconstituted with standard semi-skimmed milk). Source: ADEME Agribalyse Database.

StageImpact
Agriculture73.1 %
Processing1.3 %
Packaging6.6 %
Transportation12.4 %
Distribution3.6 %
Consumption3.3 %

Bonuses and maluses

Declared origins

Origins of ingredients are missing for this product. Ingredients need to be completed before the transportation bonus can be computed precisely.

Packaging impact

Packaging with a high impact Malus: -15 The information about the packaging of this product is not filled in.

Green-Score for this product

Green-Score for this product

DFinal score: 35/100

Final score breakdown

Life cycle analysis score: 55 Sum of bonuses and maluses: -20 Final score: 35/100

Carbon footprint

Carbon footprint

Equivalent to driving 0.7 km in a petrol car. 140 g CO2e per 100g of product. Reference category: Instant cocoa or chocolate beverage, with sugar, ready-to-drink (reconstituted with standard semi-skimmed milk). The carbon emission figure comes from ADEME's Agribalyse database, for the category: Instant cocoa or chocolate beverage, with sugar, ready-to-drink (reconstituted with standard semi-skimmed milk). Source: ADEME Agribalyse Database.

Climate impact by stage (CO2e)

The carbon emission figure comes from ADEME's Agribalyse database, for the category: Instant cocoa or chocolate beverage, with sugar, ready-to-drink (reconstituted with standard semi-skimmed milk). Source: ADEME Agribalyse Database.

StageImpact
Agriculture74.3 %
Processing0.9 %
Packaging7.0 %
Transportation15.4 %
Distribution1.2 %
Consumption0.8 %

Packaging

Packaging impact

Packaging with a high impact Malus: -15 The information about the packaging of this product is not filled in.

Declared packaging

Plastica, Vasetto

Data precision

The packaging information is not sufficiently precise to compute the most accurate packaging impact. Exact shapes and materials of all packaging components help improve the Green-Score.

Transportation

Declared origins

Origins of ingredients are missing for this product. Ingredients need to be completed before the transportation bonus can be computed precisely.

Forest footprint

Forest footprint

Low risk of deforestation Presence of one or more ingredients at risk of deforestation, but low risk given their quantity, origin and/or labels. Forest Footprint The Forest Footprint is a methodology developed by the association Envol Vert to estimate the risk of deforestation related to our consumption. → More information on the methodology Forest Footprint grade: B Presence of one or more ingredients at risk of deforestation, but low risk given their quantity, origin and/or labels. Total Forest Footprint: 0.060 m² per kg of food

Deforestation risk details

Cocoa Primary ingredient grade: B Primary ingredient: 0.060 m² per kg of food Cocoa production, concentrated mainly in West Africa, contributes significantly to deforestation. For example, Côte d'Ivoire, the leading cocoa-producing country, has lost 90% of its forests since the 1960s. Labels The presence of certain labels can greatly help reduce the risk of deforestation, through the presence of environmental criteria and/or through better remuneration of producers.

Data Source

Product data comes from Open Food Facts. Food Benchmark also adds translations, category comparisons and explanatory calculations.

The database is licensed under ODbL 1.0, individual contents under DbCL 1.0, and product photos under CC BY-SA 3.0.

Product added on June 10, 2015 at 11:22:30 AM UTC by tacite .

Last edit on March 18, 2026 at 7:30:27 AM UTC by fabiosegatta .

Product page also edited by adis123, beniben, cedagaesse, charlesnepote, davidepio, ecoscore-impact-estimator, fabiosegatta, foodless, foodrepo, halal-app-chakib, inf, macrofactor, maxtess, moon-rabbit, new-nutrition-bot, off-replace-bot, packbot, philanne, scanbot, tacite, tacite-mass-editor, thaialagata, vaporous, winners.