
Nestlé noir
Labels
 Bad nutritional quality
 Not computed
 Low environmental impact
Health
Nutrition
Label
Bad nutritional qualityNutrient levels
Fat in high quantity (20.4%)
Saturated fat in high quantity (12.3%)
Sugars in high quantity (26.6%)
Salt in low quantity (0.11%)
Nutrition facts
| Nutrition facts | As sold for 100 g / 100 ml |
|---|---|
| Energy | ~ 1,346.4 kJ (328 kcal) |
| FAT | 20.4 g |
| Saturated fat | 12.3 g |
| Carbohydrates | 31.3 g |
| Sugars | 26.6 g |
| Dietary fiber | ? |
| Proteins | 3.5 g |
| Salt | 0.11 g |
| Sodium | 0.04 g |
| Minerals | |
| Fruits, vegetables and legumes | ? |
Nutrition facts (Detailed data)
| Nutrition facts | As sold for 100 g / 100 ml | As sold Per 100 g (packaging) |
|---|---|---|
| Energy | ~ 1,346.4 kJ (328 kcal) | ? (328 kcal) |
| FAT | 20.4 g | 20.4 g |
| Saturated fat | 12.3 g | 12.3 g |
| Carbohydrates | 31.3 g | 31.3 g |
| Sugars | 26.6 g | 26.6 g |
| Dietary fiber | ? | ? |
| Proteins | 3.5 g | 3.5 g |
| Salt | 0.11 g | 0.11 g |
| Sodium | 0.04 g | 0.04 g |
| Minerals | ||
| Fruits, vegetables and legumes | ? | ? |
Estimated Activity Time
Approximate time needed to burn the energy in 100 g / 100 ml: 1,346 kJ. Reference adult weight: 70 kg. Energy density: Moderate.
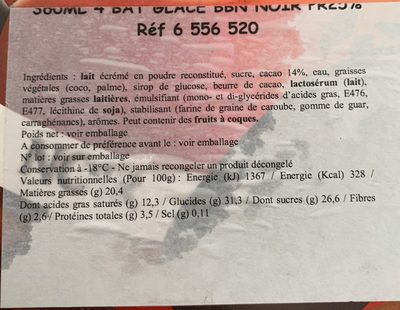
Ingredients
Ingredients image
Ingredients analysis
Palm oil content unknown
Vegan status unknown
Vegetarian status unknown
Food Processing
NOVA group
How NOVA works
Additives
Environment
Green-Score, origins bonus, and transportation impact are shown for Worldwide .
Green Score
Overall grade
Low environmental impactAbout Green-Score
Current scope
Life cycle analysis
Average impact of the category
 Ice cream, cone (normal size) • Score: 86/100
Life-cycle reference
Overall environmental impact by stage (PEF)
The overall environmental impact figure (PEF) comes from ADEME's Agribalyse database, for the category: Ice cream, cone (normal size). Source: ADEME Agribalyse Database.
| Stage | Impact |
|---|---|
| Agriculture | 50.2 % |
| Processing | 16.5 % |
| Packaging | 13.8 % |
| Transportation | 7.9 % |
| Distribution | 7.4 % |
| Consumption | 4.3 % |
Bonuses and maluses
Declared origins
Packaging impact
Green-Score for this product
Green-Score for this product
Final score: 70/100Final score breakdown
Carbon footprint
Carbon footprint
Climate impact by stage (CO2e)
The carbon emission figure comes from ADEME's Agribalyse database, for the category: Ice cream, cone (normal size). Source: ADEME Agribalyse Database.
| Stage | Impact |
|---|---|
| Agriculture | 55.2 % |
| Processing | 10.1 % |
| Packaging | 17.1 % |
| Transportation | 12.7 % |
| Distribution | 3.5 % |
| Consumption | 1.3 % |
Packaging
Packaging impact
Packaging materials
| Material | % | Packaging weight | Packaging weight per 100 g of product |
|---|---|---|---|
| Plastic | |||
| Paper or cardboard | |||
| Total |
Declared packaging
Transportation
Declared origins
Data Source
Data presented on this page is sourced from the Open Food Facts database. This platform does not alter the original dataset; its purpose is solely to enhance data visualization and user accessibility.
Product added on October 19, 2018 at 1:12:56 PM UTC by kiliweb .
Last edit on March 18, 2026 at 12:02:34 AM UTC by new-nutrition-bot .
Product page also edited by charlesnepote, co-prnt, kiliweb, new-nutrition-bot, openfoodfacts-contributors, packbot, roboto-app, tester, yuka.SC80OEFJa3hxc01UdS9FQTV5clg0T2xjNnNPQVZuSzJNUFlKSVE9PQ.