
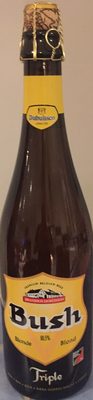
Bush triple
Labels
 Not computed
 Processed foods
 Moderate environmental impact
Health
Nutrition
Nutrition label
Nutrition facts
| Nutrition facts | As sold for 100 g / 100 ml |
|---|---|
| Energy | ? |
| FAT | ? |
| Saturated fat | ? |
| Carbohydrates | ? |
| Sugars | ? |
| Dietary fiber | ? |
| Proteins | ? |
| Salt | ? |
| Minerals | |
| Fruits, vegetables and legumes | ~ 5 % |
Nutrition facts (Detailed data)
| Nutrition facts | As sold for 100 g / 100 ml | As sold Per 100 g (estimate) |
|---|---|---|
| Energy | ? | ? |
| FAT | ? | ? |
| Saturated fat | ? | ? |
| Carbohydrates | ? | ? |
| Sugars | ? | ? |
| Added sugars | ~ 10 g | ~ 10 g |
| Dietary fiber | ? | ? |
| Proteins | ? | ? |
| Salt | ? | ? |
| Minerals | ||
| Fruits, vegetables and legumes | ~ 5 % | ~ 5 % |
Ingredients
Ingredients image
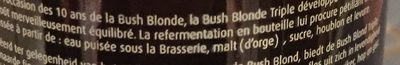
Ingredients list
Ingredient information
Allergens
Ingredients analysis
No ingredients containing palm oil.
Vegan status unknown
No non-vegetarian ingredients.
Food Processing
NOVA group
Processed foodsElements that indicate the product is in NOVA group 3
How NOVA works
Additives
Environment
Green-Score, origins bonus, and transportation impact are shown for Worldwide .
Green Score
Overall grade
Moderate environmental impactAbout Green-Score
Current scope
Life cycle analysis
Average impact of the category
Beer, "specialty", from abbey or regional (varying alcohol content) • Score: 56/100Life-cycle reference
Overall environmental impact by stage (PEF)
The overall environmental impact figure (PEF) comes from ADEME's Agribalyse database, for the category: Beer, "specialty", from abbey or regional (varying alcohol content). Source: ADEME Agribalyse Database.
| Stage | Impact |
|---|---|
| Agriculture | 8.2 % |
| Processing | 24.3 % |
| Packaging | 38.7 % |
| Transportation | 19.4 % |
| Distribution | 7.3 % |
| Consumption | 2.0 % |
Bonuses and maluses
Declared origins
Packaging impact
Green-Score for this product
Green-Score for this product
Final score: 49/100Final score breakdown
Carbon footprint
Carbon footprint
Climate impact by stage (CO2e)
The carbon emission figure comes from ADEME's Agribalyse database, for the category: Beer, "specialty", from abbey or regional (varying alcohol content). Source: ADEME Agribalyse Database.
| Stage | Impact |
|---|---|
| Agriculture | 5.9 % |
| Processing | 20.2 % |
| Packaging | 46.0 % |
| Transportation | 24.4 % |
| Distribution | 2.7 % |
| Consumption | 0.5 % |
Packaging
Packaging impact
Packaging materials
| Material | % | Packaging weight | Packaging weight per 100 g of product |
|---|---|---|---|
| Glass | |||
| Total |
Declared packaging
Transportation
Declared origins
Data Source
Data presented on this page is sourced from the Open Food Facts database. This platform does not alter the original dataset; its purpose is solely to enhance data visualization and user accessibility.
Product added on December 7, 2016 at 6:04:33 PM UTC by agamitsudo .
Last edit on March 18, 2026 at 12:47:28 AM UTC by new-nutrition-bot .
Product page also edited by agamitsudo, beniben, new-nutrition-bot, packbot, sebleouf, yuka.VGE5ZFBwd0xwZlUwcHNjVjB3bmF3ZkpKL3JTWGUyYnROUE5JSUE9PQ.