

Kenko Creamy Kin Goma Dressing 500ML
Health
Nutrition
Nutri-Score
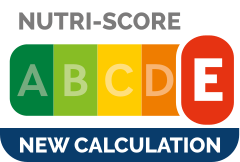 Lower nutritional quality
Nutri-Score data warning
Nutrient levels
Fat in moderate quantity (18%)
Saturated fat in low quantity (0%)
Sugars in high quantity (24.7%)
Salt in high quantity (6.7%)
Nutrition label

Nutrition facts
| Nutrition facts | As sold for 100 ml | Compared to: Salad dressings |
|---|---|---|
| Energy | ~ 1161.90001296996 kJ (247 kcal) | 1,272.052 kJ (309 kcal) (-9%) |
| Fat | 18 g | 29.114 g (-38%) |
| Saturated fat | 0 g | 3.103 g (-100%) |
| Carbohydrates | 24.700000762939 g | 8.114 g (+204%) |
| Sugars | 24.700000762939 g | 5.678 g (+335%) |
| Dietary fiber | 1 g | ? |
| Proteins | 4 g | 0.949 g (+321%) |
| Salt | 6.69999975 g | 1.751 g (+283%) |
| Sodium | 2.68 g | 0.698 g (+284%) |
| Fruits, vegetables and legumes | ~ 0 % | ? |
Nutrition facts (Detailed data)
| Nutrition facts | As sold for 100 ml | As sold Per 100 ml (packaging) | As sold Per 100 g (estimate) |
|---|---|---|---|
| Energy | ~ 1161.90001296996 kJ (247 kcal) | ? (247 kcal) | ? |
| Fat | 18 g | 18 g | ? |
| Saturated fat | 0 g | 0 g | ? |
| Carbohydrates | 24.700000762939 g | 24.700000762939 g | ? |
| Sugars | 24.700000762939 g | 24.700000762939 g | ? |
| Dietary fiber | 1 g | 1 g | ? |
| Proteins | 4 g | 4 g | ? |
| Salt | 6.69999975 g | 6.69999975 g | ? |
| Sodium | 2.68 g | 2.68 g | ? |
| Fruits, vegetables and legumes | ~ 0 % | ? | ~ 0 % |
Ingredients
Ingredients image

Ingredients list
Ingredient information
Added sugars
Allergens
Ingredients analysis
No ingredients containing palm oil.
Unrecognized: ja:新化液状ドレッシング-原材料名, ja:食用植物油脂, ja:しょ-決造群, ja:金ごま, ja:卵買, ja:しい-エキスパウダー, ja:原材料の一部に小麦-内容量
Vegan status unknown
Unrecognized: ja:食用植物油脂, ja:しょ-決造群, ja:金ごま, ja:卵買, ja:しい-エキスパウダー, ja:原材料の一部に小麦-内容量
Vegetarian status unknown
Unrecognized: ja:食用植物油脂, ja:しょ-決造群, ja:金ごま, ja:卵買, ja:しい-エキスパウダー, ja:原材料の一部に小麦-内容量
Food Processing
NOVA group
 Ultra-processed food and drink products
Elements that indicate the product is in NOVA group 4
How NOVA works
Additives
Amino acids
No additive description is available yet.
E955 - SucraloseSweetener
Sucralose is an artificial sweetener and sugar substitute. The majority of ingested sucralose is not broken down by the body, so it is noncaloric. In the European Union, it is also known under the E number E955. It is produced by chlorination of sucrose. Sucralose is about 320 to 1,000 times sweeter than sucrose, three times as sweet as both aspartame and acesulfame potassium, and twice as sweet as sodium saccharin. Evidence of benefit is lacking for long-term weight loss with some data supporting weight gain and heart disease risks.It is stable under heat and over a broad range of pH conditions. Therefore, it can be used in baking or in products that require a long shelf life. The commercial success of sucralose-based products stems from its favorable comparison to other low-calorie sweeteners in terms of taste, stability, and safety. Common brand names of sucralose-based sweeteners are Splenda, Zerocal, Sukrana, SucraPlus, Candys, Cukren, and Nevella. Canderel Yellow also contains sucralose, but the original Canderel and Green Canderel do not.
Environment
Green-Score, origins bonus, and transportation impact are shown for Worldwide .
Green Score
Overall grade
 High environmental impact
About Green-Score
Current scope
Life cycle analysis
Average impact of the category
 Salad dressing, prepacked • Score: 58/100
Life-cycle reference
Overall environmental impact by stage (PEF)
The overall environmental impact figure (PEF) comes from ADEME's Agribalyse database, for the category: Salad dressing, prepacked. Source: ADEME Agribalyse Database.
| Stage | Impact |
|---|---|
| Agriculture | 68.6 % |
| Processing | 11.3 % |
| Packaging | 11.6 % |
| Transportation | 5.8 % |
| Distribution | 2.3 % |
| Consumption | 0.6 % |
Bonuses and maluses
Declared origins
Packaging impact
Green-Score for this product
Green-Score for this product
Final score: 38/100Final score breakdown
Carbon footprint
Carbon footprint
Climate impact by stage (CO2e)
The carbon emission figure comes from ADEME's Agribalyse database, for the category: Salad dressing, prepacked. Source: ADEME Agribalyse Database.
| Stage | Impact |
|---|---|
| Agriculture | 59.7 % |
| Processing | 12.1 % |
| Packaging | 13.7 % |
| Transportation | 12.4 % |
| Distribution | 1.8 % |
| Consumption | 0.3 % |
Packaging
Packaging impact
Data precision
Transportation
Declared origins
Forest footprint
Forest footprint
Deforestation risk details
Data Source
Product data comes from Open Food Facts. Food Benchmark also adds translations, category comparisons and explanatory calculations.
The database is licensed under ODbL 1.0, individual contents under DbCL 1.0, and product photos under CC BY-SA 3.0.
Product added on February 4, 2017 at 9:05:19 PM UTC by teolemon .
Last edit on March 17, 2026 at 6:04:54 AM UTC by new-nutrition-bot .
Product page also edited by autorotate-bot, ecoscore-impact-estimator, kiliweb, new-nutrition-bot, nicolas97, openfoodfacts-contributors, roboto-app, teolemon, yuka.AJVmGc-tE9cOEMDNj9M-_juAP8f4A6JzN05Qow, yuka.V280UEhyWWVxZDRvcGZRTTREMk93TlJXbmE2amUyZXZETkFCSVE9PQ, yuka.sY2b0xO6T85zoF3NwEKvlkFHeerRvhWVPSHilV-Qy-6udJvOY8Nc2pjLOqs, yuka.sY2b0xO6T85zoF3NwEKvlnJoQufZgxTWCzjVtGyJ6vSxdZvsRNNyyLehHao, yukafix.