

Ristorante Pizza Thon
Labels
 Moderate nutritional quality
 Ultra-processed food and drink products
 High environmental impact
Health
Nutrition
Label
Moderate nutritional qualityNutrient levels
Fat in moderate quantity (14%)
Saturated fat in moderate quantity (3.4%)
Sugars in low quantity (2.9%)
Salt in moderate quantity (1.2%)
Nutrition label

Nutrition facts
| Nutrition facts | As sold for 100 g / 100 ml |
|---|---|
| Energy | 1,093 kJ (255 kcal) |
| FAT | 14 g |
| Saturated fat | 3.4 g |
| Carbohydrates | 23 g |
| Sugars | 2.9 g |
| Dietary fiber | ~ 3.41 g |
| Proteins | 9.3 g |
| Salt | 1.2 g |
| Sodium | 0.48 g |
| Minerals | |
| Fruits, vegetables and legumes | ~ 30.74 % |
Nutrition facts (Detailed data)
| Nutrition facts | As sold for 100 g / 100 ml | As sold Per 100 g (packaging) | As sold Per 100 g (estimate) |
|---|---|---|---|
| Energy | 1,093 kJ (255 kcal) | 1,093 kJ (261 kcal) | ~ 1,102.02 kJ (263 kcal) |
| FAT | 14 g | 14 g | ~ 12.41 g |
| Saturated fat | 3.4 g | 3.4 g | ~ 3.39 g |
| Cholesterol | ~ 0.02 g | ? | ~ 0.02 g |
| Carbohydrates | 23 g | 23 g | ~ 26.26 g |
| Sugars | 2.9 g | 2.9 g | ~ 2.04 g |
| Added sugars | ~ 0.29 g | ? | ~ 0.29 g |
| Sucrose | ~ 0.59 g | ? | ~ 0.59 g |
| Glucose | ~ 0.6 g | ? | ~ 0.6 g |
| Fructose | ~ 0.57 g | ? | ~ 0.57 g |
| Galactose | ~ 0.01 g | ? | ~ 0.01 g |
| Lactose | ~ 0.09 g | ? | ~ 0.09 g |
| Maltose | ~ 0.41 g | ? | ~ 0.41 g |
| Starch | ~ 20.23 g | ? | ~ 20.23 g |
| Polyols | ~ 0.01 g | ? | ~ 0.01 g |
| Dietary fiber | ~ 3.41 g | ? | ~ 3.41 g |
| Proteins | 9.3 g | 9.3 g | ~ 9.62 g |
| Salt | 1.2 g | 1.2 g | ~ 0.95 g |
| Sodium | 0.48 g | 0.48 g | ~ 0.38 g |
| Alcohol | ~ 0 % vol | ? | ~ 0 % vol |
| Vitamins | |||
| Vitamin A | ~ 0 g | ? | ~ 0 g |
| Beta-carotene | ~ 0 g | ? | ~ 0 g |
| Vitamin D | ~ 0 g | ? | ~ 0 g |
| Vitamin E | ~ 0 g | ? | ~ 0 g |
| Vitamin C | ~ 0 g | ? | ~ 0 g |
| Vitamin B1 | ~ 0 g | ? | ~ 0 g |
| Vitamin B2 | ~ 0 g | ? | ~ 0 g |
| Vitamin PP | ~ 0 g | ? | ~ 0 g |
| Vitamin B6 | ~ 0 g | ? | ~ 0 g |
| Vitamin B9 | ~ 0 g | ? | ~ 0 g |
| Vitamin B12 | ~ 0 g | ? | ~ 0 g |
| Pantothenic acid | ~ 0 g | ? | ~ 0 g |
| Minerals | |||
| Potassium | ~ 0.38 g | ? | ~ 0.38 g |
| Calcium | ~ 0.11 g | ? | ~ 0.11 g |
| Phosphorus | ~ 0.18 g | ? | ~ 0.18 g |
| Iron | ~ 0 g | ? | ~ 0 g |
| Magnesium | ~ 0.04 g | ? | ~ 0.04 g |
| Zinc | ~ 0 g | ? | ~ 0 g |
| Copper | ~ 0 g | ? | ~ 0 g |
| Manganese | ~ 0 g | ? | ~ 0 g |
| Selenium | ~ 0 g | ? | ~ 0 g |
| Iodine | ~ 0 g | ? | ~ 0 g |
| Fruits, vegetables and legumes | ~ 30.74 % | ? | ~ 30.74 % |
| Phylloquinone | ~ 8.51 g | ? | ~ 8.51 g |
| Water | ~ 45.41 g | ? | ~ 45.41 g |
Serving size
Estimated Activity Time
Approximate time needed to burn the energy in 100 g / 100 ml: 1,093 kJ. Reference adult weight: 70 kg. Energy density: Moderate.
Ingredients
Ingredients image
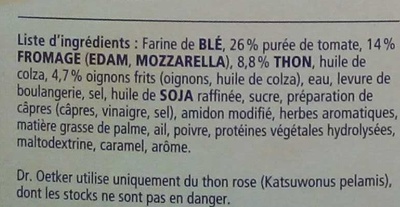
Ingredients list
Ingredient information
Allergens
Ingredients analysis
Contains ingredients containing palm oil.
Contains non-vegan ingredients.
Contains non-vegetarian ingredients.
Food Processing
NOVA group
Ultra-processed food and drink productsElements that indicate the product is in NOVA group 4
How NOVA works
Additives
E14XX - Modified StarchEmulsifierStabiliserThickener
No additive description is available yet.
Environment
Green-Score, origins bonus, and transportation impact are shown for Worldwide .
Green Score
Overall grade
High environmental impactAbout Green-Score
Current scope
Life cycle analysis
Average impact of the category
 Pizza, tuna • Score: 68/100
Life-cycle reference
Overall environmental impact by stage (PEF)
The overall environmental impact figure (PEF) comes from ADEME's Agribalyse database, for the category: Pizza, tuna. Source: ADEME Agribalyse Database.
| Stage | Impact |
|---|---|
| Agriculture | 62.7 % |
| Processing | 10.6 % |
| Packaging | 6.1 % |
| Transportation | 7.8 % |
| Distribution | 2.7 % |
| Consumption | 10.0 % |
Bonuses and maluses
Declared origins
Threatened species risk
Packaging impact
Green-Score for this product
Green-Score for this product
Final score: 42/100Final score breakdown
Carbon footprint
Carbon footprint
Climate impact by stage (CO2e)
The carbon emission figure comes from ADEME's Agribalyse database, for the category: Pizza, tuna. Source: ADEME Agribalyse Database.
| Stage | Impact |
|---|---|
| Agriculture | 63.9 % |
| Processing | 8.3 % |
| Packaging | 9.4 % |
| Transportation | 13.3 % |
| Distribution | 1.6 % |
| Consumption | 3.5 % |
Packaging
Packaging impact
Packaging materials
| Material | % | Packaging weight | Packaging weight per 100 g of product |
|---|---|---|---|
| Plastic | |||
| Paper or cardboard | |||
| Total |
Declared packaging
Transportation
Manufacturing locations
Declared origins
Data Source
Data presented on this page is sourced from the Open Food Facts database. This platform does not alter the original dataset; its purpose is solely to enhance data visualization and user accessibility.
Product added on January 17, 2016 at 6:42:21 PM UTC by segundo .
Last edit on March 18, 2026 at 12:23:56 AM UTC by new-nutrition-bot .
Product page also edited by cyn, date-limite-app, femmenoire, foodvisor, new-nutrition-bot, openfoodfacts-contributors, packbot, roboto-app, sebleouf, segundo, teolemon, viktorc.