
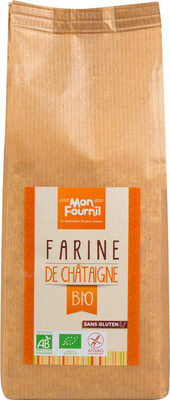
Farine de châtaigne bio sans gluten
Labels
 Moderate nutritional quality
 Unprocessed or minimally processed foods
 Very low environmental impact
Health
Nutrition
Label
Moderate nutritional qualityNutrient levels
Fat in moderate quantity (3.8%)
Saturated fat in low quantity (0.7%)
Sugars in high quantity (29.5%)
Salt in low quantity (0.03%)
Nutrition label
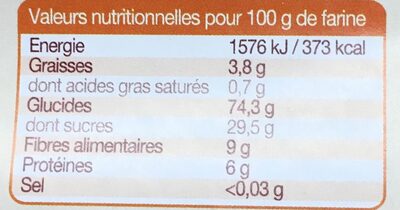
Nutrition facts
| Nutrition facts | As sold for 100 g / 100 ml |
|---|---|
| Energy | 1,576 kJ (373 kcal) |
| FAT | 3.8 g |
| Saturated fat | 0.7 g |
| Carbohydrates | 74.3 g |
| Sugars | 29.5 g |
| Dietary fiber | 9 g |
| Proteins | 6 g |
| Salt | 0.03 g |
| Sodium | 0.01 g |
| Minerals | |
| Fruits, vegetables and legumes | ~ 0 % |
Nutrition facts (Detailed data)
| Nutrition facts | As sold for 100 g / 100 ml | As sold Per 100 g (packaging) | As sold Per 100 g (estimate) |
|---|---|---|---|
| Energy | 1,576 kJ (373 kcal) | 1,576 kJ (373 kcal) | ~ 1,520 kJ (360 kcal) |
| FAT | 3.8 g | 3.8 g | ~ 3.43 g |
| Saturated fat | 0.7 g | 0.7 g | ~ 0.52 g |
| Cholesterol | ~ 0 g | ? | ~ 0 g |
| Carbohydrates | 74.3 g | 74.3 g | ~ 70.4 g |
| Sugars | 29.5 g | 29.5 g | ~ 4.25 g |
| Added sugars | ~ 0 g | ? | ~ 0 g |
| Sucrose | ~ 4.01 g | ? | ~ 4.01 g |
| Glucose | ~ 0.1 g | ? | ~ 0.1 g |
| Fructose | ~ 0.07 g | ? | ~ 0.07 g |
| Galactose | ~ 0 g | ? | ~ 0 g |
| Lactose | ~ 0 g | ? | ~ 0 g |
| Maltose | ~ 0.07 g | ? | ~ 0.07 g |
| Starch | ~ 46.9 g | ? | ~ 46.9 g |
| Polyols | ~ 0 g | ? | ~ 0 g |
| Dietary fiber | 9 g | 9 g | ~ 12.6 g |
| Proteins | 6 g | 6 g | ~ 5.69 g |
| Salt | 0.03 g | 0.03 g | ~ 0.05 g |
| Sodium | 0.01 g | 0.01 g | ~ 0.02 g |
| Alcohol | ~ 0 % vol | ? | ~ 0 % vol |
| Vitamins | |||
| Vitamin A | ~ 0 g | ? | ~ 0 g |
| Beta-carotene | ~ 0 g | ? | ~ 0 g |
| Vitamin D | ~ 0 g | ? | ~ 0 g |
| Vitamin E | ~ 0 g | ? | ~ 0 g |
| Vitamin C | ~ 0.02 g | ? | ~ 0.02 g |
| Vitamin B1 | ~ 0 g | ? | ~ 0 g |
| Vitamin B2 | ~ 0 g | ? | ~ 0 g |
| Vitamin PP | ~ 0 g | ? | ~ 0 g |
| Vitamin B6 | ~ 0 g | ? | ~ 0 g |
| Vitamin B9 | ~ 0 g | ? | ~ 0 g |
| Vitamin B12 | ~ 0 g | ? | ~ 0 g |
| Pantothenic acid | ~ 0 g | ? | ~ 0 g |
| Minerals | |||
| Potassium | ~ 0.64 g | ? | ~ 0.64 g |
| Calcium | ~ 0.06 g | ? | ~ 0.06 g |
| Phosphorus | ~ 0.44 g | ? | ~ 0.44 g |
| Iron | ~ 0 g | ? | ~ 0 g |
| Magnesium | ~ 0.07 g | ? | ~ 0.07 g |
| Zinc | ~ 0 g | ? | ~ 0 g |
| Copper | ~ 0 g | ? | ~ 0 g |
| Manganese | ~ 0 g | ? | ~ 0 g |
| Selenium | ~ 0 g | ? | ~ 0 g |
| Iodine | ~ 0 g | ? | ~ 0 g |
| Fruits, vegetables and legumes | ~ 0 % | ? | ~ 0 % |
| Phylloquinone | ~ 0 g | ? | ~ 0 g |
| Water | ~ 5.52 g | ? | ~ 5.52 g |
Estimated Activity Time
Approximate time needed to burn the energy in 100 g / 100 ml: 1,576 kJ. Reference adult weight: 70 kg. Energy density: Moderate.
Ingredients
Ingredients image

Ingredients list
Ingredient information
Ingredients analysis
No ingredients containing palm oil.
No non-vegan ingredients.
No non-vegetarian ingredients.
Food Processing
NOVA group
Unprocessed or minimally processed foodsHow NOVA works
Additives
Environment
Green-Score, origins bonus, and transportation impact are shown for Worldwide .
Green Score
Overall grade
Very low environmental impactAbout Green-Score
Current scope
Life cycle analysis
Average impact of the category
 Chestnut flour • Score: 68/100
Life-cycle reference
Overall environmental impact by stage (PEF)
The overall environmental impact figure (PEF) comes from ADEME's Agribalyse database, for the category: Chestnut flour. Source: ADEME Agribalyse Database.
| Stage | Impact |
|---|---|
| Agriculture | 90.0 % |
| Processing | 1.3 % |
| Packaging | 0.5 % |
| Transportation | 6.3 % |
| Distribution | 1.8 % |
| Consumption | 0.0 % |
Bonuses and maluses
Production system
Origins of ingredients
Packaging impact
Green-Score for this product
Green-Score for this product
Final score: 81/100Final score breakdown
Carbon footprint
Carbon footprint
Climate impact by stage (CO2e)
The carbon emission figure comes from ADEME's Agribalyse database, for the category: Chestnut flour. Source: ADEME Agribalyse Database.
| Stage | Impact |
|---|---|
| Agriculture | 84.9 % |
| Processing | 1.4 % |
| Packaging | 0.8 % |
| Transportation | 11.8 % |
| Distribution | 1.0 % |
| Consumption | 0.0 % |
Packaging

Packaging impact
Packaging materials
| Material | % | Packaging weight | Packaging weight per 100 g of product |
|---|---|---|---|
| Paper or cardboard | |||
| Total |
Declared packaging
Data precision
Transportation
Origins of ingredients
Origins breakdown
| Origin | Percent of ingredients | Impact |
|---|---|---|
| European Union | 100 % | High |
Data Source
Data presented on this page is sourced from the Open Food Facts database. This platform does not alter the original dataset; its purpose is solely to enhance data visualization and user accessibility.
Product added on June 11, 2015 at 11:15:31 AM UTC by pierrekilly .
Last edit on March 18, 2026 at 12:43:11 AM UTC by new-nutrition-bot .
Product page also edited by date-limite-app, driveoff, ecoscore-impact-estimator, fossarsa, kiliweb, magasins-u, navig491, new-nutrition-bot, packbot, pierrekilly, quentinbrd, roboto-app, segundo, tacite, youplaboum, yuka.sY2b0xO6T85zoF3NwEKvlkJmTNjSuDPYDA76nneozI6WNse2aNNqv6LLL6s.