

Curry
Labels
 Not computed
 Unprocessed or minimally processed foods
 Very high environmental impact
Health
Nutrition
Nutrition facts
| Nutrition facts | As sold for 100 g / 100 ml |
|---|---|
| Energy | ? |
| FAT | ? |
| Saturated fat | ? |
| Carbohydrates | ? |
| Sugars | ? |
| Dietary fiber | ? |
| Proteins | ? |
| Salt | ? |
| Minerals | |
| Fruits, vegetables and legumes | ~ 21.88 % |
Nutrition facts (Detailed data)
| Nutrition facts | As sold for 100 g / 100 ml | As sold Per 100 g (estimate) |
|---|---|---|
| Energy | ? | ? |
| FAT | ? | ? |
| Saturated fat | ? | ? |
| Carbohydrates | ? | ? |
| Sugars | ? | ? |
| Added sugars | ~ 0 g | ~ 0 g |
| Dietary fiber | ? | ? |
| Proteins | ? | ? |
| Salt | ? | ? |
| Minerals | ||
| Fruits, vegetables and legumes | ~ 21.88 % | ~ 21.88 % |
Ingredients
Ingredients image
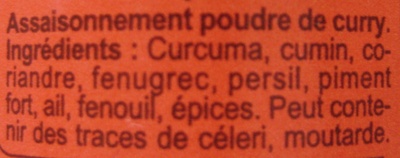
Ingredients list
Ingredient information
Allergens
Traces
Ingredients analysis
No ingredients containing palm oil.
No non-vegan ingredients.
No non-vegetarian ingredients.
Food Processing
NOVA group
Unprocessed or minimally processed foodsHow NOVA works
Additives
Environment
Green-Score, origins bonus, and transportation impact are shown for Worldwide .
Green Score
Overall grade
Very high environmental impactAbout Green-Score
Current scope
Life cycle analysis
Average impact of the category
 Curry, powder • Score: 30/100
Life-cycle reference
Overall environmental impact by stage (PEF)
The overall environmental impact figure (PEF) comes from ADEME's Agribalyse database, for the category: Curry, powder. Source: ADEME Agribalyse Database.
| Stage | Impact |
|---|---|
| Agriculture | 81.5 % |
| Processing | 3.3 % |
| Packaging | 10.8 % |
| Transportation | 4.2 % |
| Distribution | 0.4 % |
| Consumption | 0.0 % |
Bonuses and maluses
Declared origins
Packaging impact
Green-Score for this product
Green-Score for this product
Final score: 21/100Final score breakdown
Carbon footprint
Carbon footprint
Climate impact by stage (CO2e)
The carbon emission figure comes from ADEME's Agribalyse database, for the category: Curry, powder. Source: ADEME Agribalyse Database.
| Stage | Impact |
|---|---|
| Agriculture | 75.5 % |
| Processing | 4.6 % |
| Packaging | 14.9 % |
| Transportation | 4.7 % |
| Distribution | 0.2 % |
| Consumption | 0.0 % |
Packaging
Packaging impact
Packaging materials
| Material | % | Packaging weight | Packaging weight per 100 g of product |
|---|---|---|---|
| Glass | 94.5 % | 103.18 g | 245.67 g |
| Plastic | 5.5 % | 6.01 g | 14.31 g |
| Total | 100 % | 109.19 g | 259.98 g |
Declared packaging
Transportation
Manufacturing locations
Declared origins
Data Source
Data presented on this page is sourced from the Open Food Facts database. This platform does not alter the original dataset; its purpose is solely to enhance data visualization and user accessibility.
Product added on July 15, 2013 at 3:00:40 PM UTC by miles67off .
Last edit on March 17, 2026 at 11:51:12 PM UTC by new-nutrition-bot .
Product page also edited by date-limite-app, didierg, digoarj, driveoff, ecoscore-impact-estimator, foodless, jacob80, lanskaya, manu1400, miles67off, naruyoko, navig491, new-nutrition-bot, org-carrefour, packbot, teolemon, yuka.U2FRdkhKd3NxY01OcGNVdjhCM2EvTlJxMmMrbkRVU21BdGdRSVE9PQ.
Source List
- carrefour