
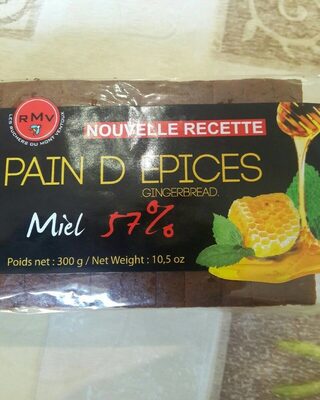
Pain d épices au miel 57%
Health
Nutrition
Nutri-Score
 Lower nutritional quality
Nutri-Score data warning
Nutrient levels
Fat in low quantity (0.8%)
Saturated fat in low quantity (0.2%)
Sugars in high quantity (47%)
Salt in moderate quantity (0.6%)
Nutrition label

Nutrition facts
| Nutrition facts | As sold for 100 g / 100 ml | Compared to: Gingerbreads |
|---|---|---|
| Energy | ~ 1370.9 kJ (328 kcal) | 1,492.014 kJ (354 kcal) (-8%) |
| Fat | 0.8 g | 5.887 g (-86%) |
| Saturated fat | 0.2 g | 2.08 g (-90%) |
| Carbohydrates | 76 g | 68.566 g (+11%) |
| Sugars | 47 g | 40.427 g (+16%) |
| Dietary fiber | ~ 2.225 g | ? |
| Proteins | 2.9 g | 4.916 g (-41%) |
| Salt | 0.6 g | 0.408 g (+47%) |
| Sodium | 0.24 g | 0.163 g (+47%) |
| Fruits, vegetables and legumes | ~ 0 % | ? |
Nutrition facts (Detailed data)
| Nutrition facts | As sold for 100 g / 100 ml | As sold Per 100 g (packaging) | As sold Per 100 g (estimate) |
|---|---|---|---|
| Energy | ~ 1370.9 kJ (328 kcal) | ? (328 kcal) | ~ 947.642857142857 kJ (224 kcal) |
| Fat | 0.8 g | 0.8 g | ~ 5.80910714285715 g |
| Saturated fat | 0.2 g | 0.2 g | ~ 0.613660714285715 g |
| Carbohydrates | 76 g | 76 g | ~ 63.4221428571429 g |
| Sugars | 47 g | 47 g | ~ 40.7367857142857 g |
| Dietary fiber | ~ 2.225 g | ? | ~ 2.225 g |
| Proteins | 2.9 g | 2.9 g | ~ 3.22223214285714 g |
| Salt | 0.6 g | 0.6 g | ~ 0.0212696428571429 g |
| Sodium | 0.24 g | 0.24 g | ~ 0.00787196428571429 g |
| Fruits, vegetables and legumes | ~ 0 % | ? | ~ 0 % |
Ingredients
Ingredients image

Ingredients list
Ingredient information
Added sugars
Allergens
Traces
Ingredients analysis
No ingredients containing palm oil.
Contains non-vegan ingredients.
No non-vegetarian ingredients.
Food Processing
NOVA group
 Ultra-processed food and drink products
Elements that indicate the product is in NOVA group 4
How NOVA works
Additives
E450 - Diphosphates EFSA overexposure risk: highEmulsifierHumectantSequestrantStabiliserThickener
Diphosphates (E450) are food additives often utilized to modify the texture of products, acting as leavening agents in baking and preventing the coagulation of canned food.
These salts can stabilize whipped cream and are also found in powdered products to maintain their flow properties. They are commonly present in baked goods, processed meats, and soft drinks.
Derived from phosphoric acid, they're part of our daily phosphate intake, which often surpasses recommended levels due to the prevalence of phosphates in processed foods and drinks.
Excessive phosphate consumption is linked to health issues, such as impaired kidney function and weakened bone health. Though diphosphates are generally regarded as safe when consumed within established acceptable daily intakes, it's imperative to monitor overall phosphate consumption to maintain optimal health.
E500 - Sodium carbonatesStabiliserThickener
Sodium carbonates (E500) are compounds commonly used in food preparation as leavening agents, helping baked goods rise by releasing carbon dioxide when they interact with acids.
Often found in baking soda, they regulate the pH of food, preventing it from becoming too acidic or too alkaline. In the culinary world, sodium carbonates can also enhance the texture and structure of foods, such as noodles, by modifying the gluten network.
Generally recognized as safe, sodium carbonates are non-toxic when consumed in typical amounts found in food.
E500ii - Sodium hydrogen carbonateStabiliserThickener
Sodium hydrogen carbonate, also known as E500ii, is a food additive commonly used as a leavening agent.
When added to recipes, it releases carbon dioxide gas upon exposure to heat or acids, causing dough to rise and resulting in a light, fluffy texture in baked goods.
It is generally recognized as safe (GRAS) by regulatory authorities when used in appropriate quantities and poses no significant health risks when consumed in typical food applications.
Environment
Green-Score, origins bonus, and transportation impact are shown for Worldwide .
Green Score
Overall grade
 Very low environmental impact
About Green-Score
Current scope
Life cycle analysis
Average impact of the category
Gingerbread • Score: 82/100Life-cycle reference
Overall environmental impact by stage (PEF)
The overall environmental impact figure (PEF) comes from ADEME's Agribalyse database, for the category: Gingerbread. Source: ADEME Agribalyse Database.
| Stage | Impact |
|---|---|
| Agriculture | 50.4 % |
| Processing | 12.8 % |
| Packaging | 28.8 % |
| Transportation | 6.0 % |
| Distribution | 2.1 % |
| Consumption | 0.0 % |
Bonuses and maluses
Declared origins
Packaging impact
Green-Score for this product
Green-Score for this product
Final score: 76/100Final score breakdown
Carbon footprint
Carbon footprint
Climate impact by stage (CO2e)
The carbon emission figure comes from ADEME's Agribalyse database, for the category: Gingerbread. Source: ADEME Agribalyse Database.
| Stage | Impact |
|---|---|
| Agriculture | 37.5 % |
| Processing | 7.0 % |
| Packaging | 46.4 % |
| Transportation | 7.8 % |
| Distribution | 1.1 % |
| Consumption | 0.0 % |
Packaging

Packaging impact
Packaging materials
| Material | % | Packaging weight | Packaging weight per 100 g of product |
|---|---|---|---|
| Unknown | 100 % | ||
| Total | 100 % |
Packaging components
| Shape | Material | Recycling | Impact |
|---|---|---|---|
| Film | Unknown | Unknown | High |
Data precision
Transportation
Declared origins
Forest footprint
Forest footprint
Deforestation risk details
Data Source
Product data comes from Open Food Facts. Food Benchmark also adds translations, category comparisons and explanatory calculations.
The database is licensed under ODbL 1.0, individual contents under DbCL 1.0, and product photos under CC BY-SA 3.0.
Product added on March 21, 2018 at 12:35:59 PM UTC by kiliweb .
Last edit on March 17, 2026 at 10:54:32 AM UTC by new-nutrition-bot .
Product page also edited by fgouget, kiliweb, new-nutrition-bot, openfoodfacts-contributors, roboto-app, teolemon, void, yuka.A61DbMG2M8YME_T84I8Y8ja5E9bCCsBpBiYXoQ, yuka.DqAeBuCPQ80BOfH7jZ4F7iOqELm4Xf9CMSYQoQ, yuka.LZEbMcWAI_F8O8jwz6A63TqkHd_hBuZnNlgSog, yuka.R2FBdUQ1WWNvZEpSbGZjMy9oZU4vTmRKNXFTc1hqbTBjYkVMSVE9PQ, yuka.sY2b0xO6T85zoF3NwEKvllZ9VOTgmQ7YCkTkxW_SydewE8HVMe9ezZP1LKs.