

Queues de gambas
Labels
 Good nutritional quality
 Processed foods
Health
Nutrition
Label
Good nutritional qualityNutrient levels
Fat in low quantity (1.1%)
Saturated fat in low quantity (0.5%)
Sugars in low quantity (0.5%)
Salt in high quantity (1.8%)
Nutrition label

Nutrition facts
| Nutrition facts | As sold for 100 g / 100 ml |
|---|---|
| Energy | ~ 397.7 kJ (92 kcal) |
| FAT | 1.1 g |
| Saturated fat | 0.5 g |
| Carbohydrates | 0.5 g |
| Sugars | 0.5 g |
| Dietary fiber | ~ 0 g |
| Proteins | 20.5 g |
| Salt | 1.8 g |
| Sodium | 0.72 g |
| Minerals | |
| Fruits, vegetables and legumes | ~ 0 % |
Nutrition facts (Detailed data)
| Nutrition facts | As sold for 100 g / 100 ml | As sold Per 100 g (packaging) | As sold Per 100 g (estimate) |
|---|---|---|---|
| Energy | ~ 397.7 kJ (92 kcal) | ? (92 kcal) | ~ 404.88 kJ (95 kcal) |
| FAT | 1.1 g | 1.1 g | ~ 0.81 g |
| Saturated fat | 0.5 g | 0.5 g | ~ 0.18 g |
| Cholesterol | ~ 0.14 g | ? | ~ 0.14 g |
| Carbohydrates | 0.5 g | 0.5 g | ~ 3.09 g |
| Sugars | 0.5 g | 0.5 g | ~ 0 g |
| Added sugars | ~ 0 g | ? | ~ 0 g |
| Sucrose | ~ 0 g | ? | ~ 0 g |
| Glucose | ~ 0 g | ? | ~ 0 g |
| Fructose | ~ 0 g | ? | ~ 0 g |
| Galactose | ~ 0 g | ? | ~ 0 g |
| Lactose | ~ 0 g | ? | ~ 0 g |
| Maltose | ~ 0 g | ? | ~ 0 g |
| Starch | ~ 0 g | ? | ~ 0 g |
| Polyols | ~ 0 g | ? | ~ 0 g |
| Dietary fiber | ~ 0 g | ? | ~ 0 g |
| Proteins | 20.5 g | 20.5 g | ~ 18.99 g |
| Salt | 1.8 g | 1.8 g | ~ 1.31 g |
| Sodium | 0.72 g | 0.72 g | ~ 0.53 g |
| Alcohol | ~ 0 % vol | ? | ~ 0 % vol |
| Vitamins | |||
| Vitamin A | ~ 0 g | ? | ~ 0 g |
| Beta-carotene | ~ 0 g | ? | ~ 0 g |
| Vitamin D | ~ 0 g | ? | ~ 0 g |
| Vitamin E | ~ 0 g | ? | ~ 0 g |
| Vitamin C | ~ 0 g | ? | ~ 0 g |
| Vitamin B1 | ~ 0 g | ? | ~ 0 g |
| Vitamin B2 | ~ 0 g | ? | ~ 0 g |
| Vitamin PP | ~ 0 g | ? | ~ 0 g |
| Vitamin B6 | ~ 0 g | ? | ~ 0 g |
| Vitamin B9 | ~ 0 g | ? | ~ 0 g |
| Vitamin B12 | ~ 0 g | ? | ~ 0 g |
| Pantothenic acid | ~ 0 g | ? | ~ 0 g |
| Minerals | |||
| Potassium | ~ 0.27 g | ? | ~ 0.27 g |
| Calcium | ~ 0.08 g | ? | ~ 0.08 g |
| Phosphorus | ~ 0.19 g | ? | ~ 0.19 g |
| Iron | ~ 0 g | ? | ~ 0 g |
| Magnesium | ~ 0.05 g | ? | ~ 0.05 g |
| Zinc | ~ 0 g | ? | ~ 0 g |
| Copper | ~ 0 g | ? | ~ 0 g |
| Manganese | ~ 0 g | ? | ~ 0 g |
| Selenium | ~ 0 g | ? | ~ 0 g |
| Iodine | ~ 0 g | ? | ~ 0 g |
| Fruits, vegetables and legumes | ~ 0 % | ? | ~ 0 % |
| Phylloquinone | ~ 0 g | ? | ~ 0 g |
| Water | ~ 71.63 g | ? | ~ 71.63 g |
Estimated Activity Time
Approximate time needed to burn the energy in 100 g / 100 ml: 398 kJ. Reference adult weight: 70 kg. Energy density: Low.
Ingredients
Ingredients image
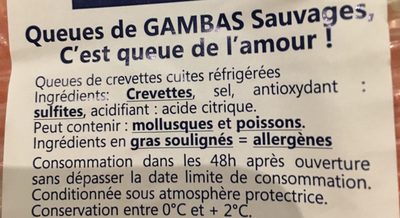
Ingredients list
Ingredient information
Allergens
Traces
Ingredients analysis
No ingredients containing palm oil.
Contains non-vegan ingredients.
Unrecognized: fr:ingredients-en-gras-soulignes-allergenes-consommation-dans-les-48h
Contains non-vegetarian ingredients.
Unrecognized: fr:ingredients-en-gras-soulignes-allergenes-consommation-dans-les-48h
Food Processing
NOVA group
Processed foodsElements that indicate the product is in NOVA group 3
How NOVA works
Additives
E330 - Citric acidAntioxidantSequestrant
Citric acid is a natural organic acid found in citrus fruits such as lemons, oranges, and limes.
It is widely used in the food industry as a flavor enhancer, acidulant, and preservative due to its tart and refreshing taste.
Citric acid is safe for consumption when used in moderation and is considered a generally recognized as safe (GRAS) food additive by regulatory agencies worldwide.
Environment
Green-Score, origins bonus, and transportation impact are shown for Worldwide .
Green Score
Overall grade
About Green-Score
Current scope
Life cycle analysis
Average impact of the category
Life-cycle reference
Overall environmental impact by stage (PEF)
The overall environmental impact figure (PEF) comes from ADEME's Agribalyse database, for the category: Shrimp or prawn, raw. Source: ADEME Agribalyse Database.
| Stage | Impact |
|---|---|
| Agriculture | 94.2 % |
| Processing | 0.0 % |
| Packaging | 1.3 % |
| Transportation | 3.0 % |
| Distribution | 0.6 % |
| Consumption | 0.7 % |
Bonuses and maluses
Declared origins
Packaging impact
Green-Score for this product
Green-Score for this product
Final score breakdown
Carbon footprint
Carbon footprint
Climate impact by stage (CO2e)
The carbon emission figure comes from ADEME's Agribalyse database, for the category: Shrimp or prawn, raw. Source: ADEME Agribalyse Database.
| Stage | Impact |
|---|---|
| Agriculture | 88.2 % |
| Processing | 0.0 % |
| Packaging | 3.4 % |
| Transportation | 6.2 % |
| Distribution | 0.4 % |
| Consumption | 2.0 % |
Packaging
Packaging impact
Packaging materials
| Material | % | Packaging weight | Packaging weight per 100 g of product |
|---|---|---|---|
| Plastic | |||
| Total |
Declared packaging
Transportation
Declared origins
Data Source
Data presented on this page is sourced from the Open Food Facts database. This platform does not alter the original dataset; its purpose is solely to enhance data visualization and user accessibility.
Product added on October 19, 2018 at 5:48:13 PM UTC by kiliweb .
Last edit on March 17, 2026 at 9:38:07 PM UTC by new-nutrition-bot .
Product page also edited by kiliweb, laura-chaud, new-nutrition-bot, openfoodfacts-contributors, quentinbrd, roboto-app, teolemon, yuka.UmZrdU1Lc2RwTWhSb1BObC9oTFYwOEJ6elpiMVVHM3ZPYkFVSWc9PQ, yuka.sY2b0xO6T85zoF3NwEKvlld6TYfPuz_ZDyX6mk_Umf3RKKPOYdtd5JfiY6o.