

Curry Madras Fort
Labels
 Not computed
 Processed foods
 High environmental impact
Health
Nutrition
Nutrition facts
| Nutrition facts | As sold for 100 g / 100 ml |
|---|---|
| Energy | ? |
| FAT | ? |
| Saturated fat | ? |
| Carbohydrates | ? |
| Sugars | ? |
| Dietary fiber | ? |
| Proteins | ? |
| Salt | ? |
| Minerals | |
| Fruits, vegetables and legumes | ~ 25.56 % |
Nutrition facts (Detailed data)
| Nutrition facts | As sold for 100 g / 100 ml | As sold Per 100 g (estimate) |
|---|---|---|
| Energy | ? | ? |
| FAT | ? | ? |
| Saturated fat | ? | ? |
| Carbohydrates | ? | ? |
| Sugars | ? | ? |
| Added sugars | ~ 8 g | ~ 8 g |
| Dietary fiber | ? | ? |
| Proteins | ? | ? |
| Salt | ? | ? |
| Minerals | ||
| Fruits, vegetables and legumes | ~ 25.56 % | ~ 25.56 % |
Ingredients
Ingredients image
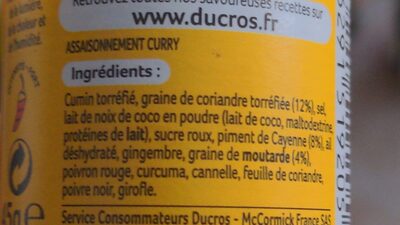
Ingredients list
Ingredient information
Allergens
Ingredients analysis
No ingredients containing palm oil.
Vegan status unknown
Unrecognized: fr:maltodextrine-proteines-de-lait
Vegetarian status unknown
Unrecognized: fr:maltodextrine-proteines-de-lait
Food Processing
NOVA group
Processed foodsElements that indicate the product is in NOVA group 3
How NOVA works
Additives
Environment
Green-Score, origins bonus, and transportation impact are shown for Worldwide .
Green Score
Overall grade
High environmental impactAbout Green-Score
Current scope
Life cycle analysis
Average impact of the category
Mix of 4 spices • Score: 41/100Life-cycle reference
Overall environmental impact by stage (PEF)
The overall environmental impact figure (PEF) comes from ADEME's Agribalyse database, for the category: Mix of 4 spices. Source: ADEME Agribalyse Database.
| Stage | Impact |
|---|---|
| Agriculture | 74.4 % |
| Processing | 2.9 % |
| Packaging | 16.0 % |
| Transportation | 6.1 % |
| Distribution | 0.6 % |
| Consumption | 0.0 % |
Bonuses and maluses
Declared origins
Packaging impact
Green-Score for this product
Green-Score for this product
Final score: 34/100Final score breakdown
Carbon footprint
Carbon footprint
Climate impact by stage (CO2e)
The carbon emission figure comes from ADEME's Agribalyse database, for the category: Mix of 4 spices. Source: ADEME Agribalyse Database.
| Stage | Impact |
|---|---|
| Agriculture | 67.0 % |
| Processing | 4.0 % |
| Packaging | 21.9 % |
| Transportation | 6.9 % |
| Distribution | 0.3 % |
| Consumption | 0.0 % |
Packaging
Packaging impact
Packaging materials
| Material | % | Packaging weight | Packaging weight per 100 g of product |
|---|---|---|---|
| Glass | |||
| Total |
Declared packaging
Transportation
Declared origins
Data Source
Data presented on this page is sourced from the Open Food Facts database. This platform does not alter the original dataset; its purpose is solely to enhance data visualization and user accessibility.
Product added on June 11, 2015 at 8:25:17 AM UTC by openfoodfacts-contributors .
Last edit on March 17, 2026 at 10:53:15 PM UTC by new-nutrition-bot .
Product page also edited by anonymous-h4fe4z22fq, fix-missing-lang-bot, gluten-scan, guezguez-majed, kiliweb, new-nutrition-bot, openfoodfacts-contributors, packbot, tom360, yuka.V2FRbVMvd0RxOWdCbnNjUzdEVEs0TjVhNUxXVVcwSHNldVVCSWc9PQ, yuka.WG9ZNU1xa2xsOEpSaXN3SDNVcU4yOGxybDg2RllrVHRHclVUSWc9PQ, yuka.WVljaE40TU9oTmxidjhZNHhFL3Z4L2R5bXNHSFVXeUlCOG9ySVE9PQ, yuka.Zll3NU1LVmNnTm9MbU1OdjRoalIwY2d0OXNPVWJ6MjJOOU13SVE9PQ.