
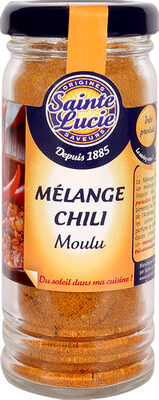
Mélange chili
Labels
 Not computed
 Processed foods
 High environmental impact
Health
Nutrition
Nutrition facts
| Nutrition facts | As sold for 100 g / 100 ml |
|---|---|
| Energy | ? |
| FAT | ? |
| Saturated fat | ? |
| Carbohydrates | ? |
| Sugars | ? |
| Dietary fiber | ? |
| Proteins | ? |
| Salt | ? |
| Minerals | |
| Fruits, vegetables and legumes | ~ 88.38 % |
Nutrition facts (Detailed data)
| Nutrition facts | As sold for 100 g / 100 ml | As sold Per 100 g (estimate) |
|---|---|---|
| Energy | ? | ? |
| FAT | ? | ? |
| Saturated fat | ? | ? |
| Carbohydrates | ? | ? |
| Sugars | ? | ? |
| Added sugars | ~ 0 g | ~ 0 g |
| Dietary fiber | ? | ? |
| Proteins | ? | ? |
| Salt | ? | ? |
| Minerals | ||
| Fruits, vegetables and legumes | ~ 88.38 % | ~ 88.38 % |
Ingredients
Ingredients image
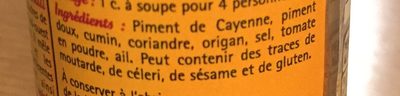
Ingredients list
Ingredient information
Traces
Ingredients analysis
No ingredients containing palm oil.
No non-vegan ingredients.
No non-vegetarian ingredients.
Food Processing
NOVA group
Processed foodsElements that indicate the product is in NOVA group 3
How NOVA works
Additives
Environment
Green-Score, origins bonus, and transportation impact are shown for Worldwide .
Green Score
Overall grade
High environmental impactAbout Green-Score
Current scope
Life cycle analysis
Average impact of the category
Mix of 4 spices • Score: 41/100Life-cycle reference
Overall environmental impact by stage (PEF)
The overall environmental impact figure (PEF) comes from ADEME's Agribalyse database, for the category: Mix of 4 spices. Source: ADEME Agribalyse Database.
| Stage | Impact |
|---|---|
| Agriculture | 74.4 % |
| Processing | 2.9 % |
| Packaging | 16.0 % |
| Transportation | 6.1 % |
| Distribution | 0.6 % |
| Consumption | 0.0 % |
Bonuses and maluses
Declared origins
Packaging impact
Green-Score for this product
Green-Score for this product
Final score: 34/100Final score breakdown
Carbon footprint
Carbon footprint
Climate impact by stage (CO2e)
The carbon emission figure comes from ADEME's Agribalyse database, for the category: Mix of 4 spices. Source: ADEME Agribalyse Database.
| Stage | Impact |
|---|---|
| Agriculture | 67.0 % |
| Processing | 4.0 % |
| Packaging | 21.9 % |
| Transportation | 6.9 % |
| Distribution | 0.3 % |
| Consumption | 0.0 % |
Packaging
Packaging impact
Packaging materials
| Material | % | Packaging weight | Packaging weight per 100 g of product |
|---|---|---|---|
| Glass | |||
| Total |
Declared packaging
Transportation
Declared origins
Data Source
Data presented on this page is sourced from the Open Food Facts database. This platform does not alter the original dataset; its purpose is solely to enhance data visualization and user accessibility.
Product added on August 23, 2016 at 1:09:34 PM UTC by date-limite-app .
Last edit on March 17, 2026 at 11:31:41 PM UTC by new-nutrition-bot .
Product page also edited by date-limite-app, kiliweb, lehegarf, new-nutrition-bot, openfoodfacts-contributors, packbot, rosy182, sainte-lucie, sebleouf, teolemon, yuka.WW9jOER2UlJtT0VIbzlzQzNUK0w5K3A4Kzc2a2MzaWFGZVk4SVE9PQ.
Source List