
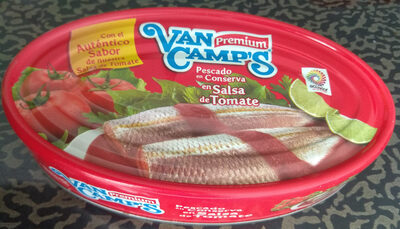
Pescado en Conserva en Salsa de Tomate
Labels
 Good nutritional quality
 Ultra-processed food and drink products
 High environmental impact
Health
Nutrition
Label
Good nutritional qualityNutrient levels
Fat in moderate quantity (9.09%)
Saturated fat in moderate quantity (2.36%)
Sugars in low quantity (1.82%)
Salt in moderate quantity (0.909%)
Nutrition label
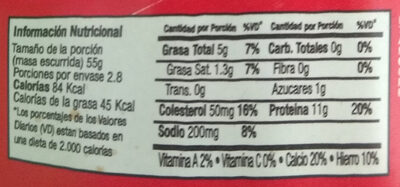
Nutrition facts
| Nutrition facts | As sold for 100 g / 100 ml |
|---|---|
| Energy | ~ 707.27 kJ (153 kcal) |
| FAT | 9.09 g |
| Saturated fat | 2.36 g |
| Cholesterol | 0.09 g |
| Carbohydrates | 1.82 g |
| Sugars | 1.82 g |
| Added sugars | 0 g |
| Starch | 0 g |
| Dietary fiber | 0 g |
| Proteins | 20 g |
| Salt | 0.91 g |
| Sodium | 0.36 g |
| Vitamins | |
| Vitamin A | 0 g |
| Vitamin E | 0 g |
| Vitamin K | 0 g |
| Vitamin C | 0 g |
| Minerals | |
| Calcium | 0.47 g |
| Phosphorus | 0 g |
| Iron | 0 g |
| Magnesium | 0 g |
| Zinc | 0 g |
| Copper | 0 g |
| Manganese | 0 g |
| Selenium | 0 g |
| Caffeine | 0 g |
| Fruits, vegetables and legumes | ~ 10.94 % |
| Choline | 0 g |
Nutrition facts (Detailed data)
| Nutrition facts | As sold for 100 g / 100 ml | As sold Per serving (55 g) (packaging) | As sold Per 100 g (estimate) |
|---|---|---|---|
| Energy | ~ 707.27 kJ (153 kcal) | ? (84 kcal) | ? |
| FAT | 9.09 g | 5 g | ? |
| Saturated fat | 2.36 g | 1.3 g | ? |
| Cholesterol | 0.09 g | 0.05 g | ? |
| Carbohydrates | 1.82 g | 1 g | ? |
| Sugars | 1.82 g | 1 g | ? |
| Added sugars | 0 g | 0 g | ~ 1 g |
| Starch | 0 g | 0 g | ? |
| Dietary fiber | 0 g | 0 g | ? |
| Proteins | 20 g | 11 g | ? |
| Salt | 0.91 g | 0.5 g | ? |
| Sodium | 0.36 g | 0.2 g | ? |
| Vitamins | |||
| Vitamin A | 0 g | 0 g | ? |
| Vitamin E | 0 g | 0 g | ? |
| Vitamin K | 0 g | 0 g | ? |
| Vitamin C | 0 g | 0 g | ? |
| Minerals | |||
| Calcium | 0.47 g | 0.26 g | ? |
| Phosphorus | 0 g | 0 g | ? |
| Iron | 0 g | 0 g | ? |
| Magnesium | 0 g | 0 g | ? |
| Zinc | 0 g | 0 g | ? |
| Copper | 0 g | 0 g | ? |
| Manganese | 0 g | 0 g | ? |
| Selenium | 0 g | 0 g | ? |
| Caffeine | 0 g | 0 g | ? |
| Fruits, vegetables and legumes | ~ 10.94 % | ? | ~ 10.94 % |
| Choline | 0 g | 0 g | ? |
Serving size
Estimated Activity Time
Approximate time needed to burn the energy in 100 g / 100 ml: 707 kJ. Reference adult weight: 70 kg. Energy density: Low.
Ingredients
Ingredients image
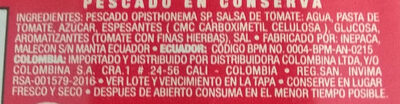
Ingredients list
Ingredient information
Ingredients analysis
No ingredients containing palm oil.
Vegan status unknown
Unrecognized: es:pescado-opisthonema-sp, es:cmc-carboximetil-celulosa, es:tomate-con-finas-hierbas
Vegetarian status unknown
Unrecognized: es:pescado-opisthonema-sp, es:cmc-carboximetil-celulosa, es:tomate-con-finas-hierbas
Food Processing
NOVA group
Ultra-processed food and drink productsElements that indicate the product is in NOVA group 4
How NOVA works
Additives
E466 - Sodium carboxy methyl celluloseEmulsifierHumectantStabiliserThickener
Carboxymethyl cellulose (CMC) or cellulose gum or tylose powder is a cellulose derivative with carboxymethyl groups (-CH2-COOH) bound to some of the hydroxyl groups of the glucopyranose monomers that make up the cellulose backbone. It is often used as its sodium salt, sodium carboxymethyl cellulose.
Environment
Green-Score, origins bonus, and transportation impact are shown for Worldwide .
Green Score
Overall grade
High environmental impactAbout Green-Score
Current scope
Life cycle analysis
Average impact of the category
 European pilchard or sardine, in tomato sauce, canned, drained • Score: 52/100
Life-cycle reference
Overall environmental impact by stage (PEF)
The overall environmental impact figure (PEF) comes from ADEME's Agribalyse database, for the category: European pilchard or sardine, in tomato sauce, canned, drained. Source: ADEME Agribalyse Database.
| Stage | Impact |
|---|---|
| Agriculture | 62.7 % |
| Processing | 6.7 % |
| Packaging | 25.0 % |
| Transportation | 4.3 % |
| Distribution | 1.3 % |
| Consumption | 0.0 % |
Bonuses and maluses
Origins of ingredients
Packaging impact
Green-Score for this product
Green-Score for this product
Final score: 33/100Final score breakdown
Carbon footprint
Carbon footprint
Climate impact by stage (CO2e)
The carbon emission figure comes from ADEME's Agribalyse database, for the category: European pilchard or sardine, in tomato sauce, canned, drained. Source: ADEME Agribalyse Database.
| Stage | Impact |
|---|---|
| Agriculture | 30.8 % |
| Processing | 13.1 % |
| Packaging | 45.3 % |
| Transportation | 10.3 % |
| Distribution | 0.8 % |
| Consumption | 0.0 % |
Packaging
Packaging impact
Data precision
Transportation
Origins of ingredients
Origins breakdown
| Origin | Percent of ingredients | Impact |
|---|---|---|
| Ecuador | 100 % | High |
Data Source
Data presented on this page is sourced from the Open Food Facts database. This platform does not alter the original dataset; its purpose is solely to enhance data visualization and user accessibility.
Product added on December 10, 2018 at 12:36:02 AM UTC by date-limite-app .
Last edit on March 17, 2026 at 11:36:22 PM UTC by new-nutrition-bot .
Product page also edited by aleene, colaborador-anonimo, date-limite-app, foodless, gaellebourdonnec, icaicedo89, municorn-calorie-counter-app, new-nutrition-bot, openfoodfacts-contributors, teolemon.