
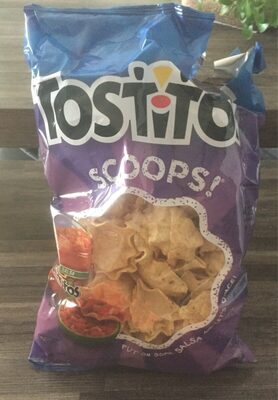
Scoops! Original
Health
Nutrition
Nutri-Score
 Lower nutritional quality
Nutrient levels
Fat in high quantity (25%)
Saturated fat in moderate quantity (3.57%)
Sugars in low quantity (0%)
Salt in moderate quantity (1.03%)
Nutrition facts
| Nutrition facts | As sold for 100 g / 100 ml | Compared to: Corn chips |
|---|---|---|
| Energy | ~ 2228.8 kJ (500 kcal) | 2,045.513 kJ (488 kcal) (+9%) |
| Fat | 25 g | 23.083 g (+8%) |
| Saturated fat | 3.57 g | 3.253 g (+10%) |
| Trans fat | 0 g | 0.01 g (-100%) |
| Cholesterol | 0 g | 0.113 mg (-100%) |
| Carbohydrates | 67.86 g | 61.312 g (+11%) |
| Sugars | 0 g | 2.124 g (-100%) |
| Added sugars | 0 g | 0.626 g (-100%) |
| Starch | 0 g | 30.388 g (-100%) |
| Dietary fiber | 3.6 g | ? |
| Proteins | 7.14 g | 6.623 g (+8%) |
| Salt | 1.03 g | 1.219 g (-16%) |
| Sodium | 0.412 g | 0.486 g (-15%) |
| Vitamin A | 0 g | 0.148 µg (-100%) |
| Vitamin E | 0 g | 7.699 mg (-100%) |
| Vitamin K | 0 g | 0 µg |
| Vitamin C | 0 g | ? |
| Potassium | 0.143 g | 178.176 mg (-20%) |
| Calcium | 0.107 g | 47.129 mg (+127%) |
| Phosphorus | 0 g | 90.746 mg (-100%) |
| Iron | 0.00267857142857143 g | 1.37 mg (+96%) |
| Magnesium | 0 g | 35.808 mg (-100%) |
| Zinc | 0 g | 0.618 mg (-100%) |
| Copper | 0 g | 0.099 mg (-100%) |
| Manganese | 0 g | 0.233 mg (-100%) |
| Selenium | 0 g | 5.883 µg (-100%) |
| Caffeine | 0 g | 0 mg |
| Fruits, vegetables and legumes | ~ 0 % | ? |
| Choline | 0 g | 0 g |
Nutrition facts (Detailed data)
| Nutrition facts | As sold for 100 g / 100 ml | As sold Per 100 g (packaging) | As sold Per 100 g (estimate) |
|---|---|---|---|
| Energy | ~ 2228.8 kJ (500 kcal) | ? (500 kcal) | ? |
| Fat | 25 g | 25 g | ? |
| Saturated fat | 3.57 g | 3.57 g | ? |
| Trans fat | 0 g | 0 g | ? |
| Cholesterol | 0 g | 0 g | ? |
| Carbohydrates | 67.86 g | 67.86 g | ? |
| Sugars | 0 g | 0 g | ? |
| Added sugars | 0 g | 0 g | ~ 0 g |
| Starch | 0 g | 0 g | ? |
| Dietary fiber | 3.6 g | 3.6 g | ? |
| Proteins | 7.14 g | 7.14 g | ? |
| Salt | 1.03 g | 1.03 g | ? |
| Sodium | 0.412 g | 0.412 g | ? |
| Vitamin A | 0 g | 0 g | ? |
| Vitamin E | 0 g | 0 g | ? |
| Vitamin K | 0 g | 0 g | ? |
| Vitamin C | 0 g | 0 g | ? |
| Potassium | 0.143 g | 0.143 g | ? |
| Calcium | 0.107 g | 0.107 g | ? |
| Phosphorus | 0 g | 0 g | ? |
| Iron | 0.00267857142857143 g | 2.67857142857143 mg | ? |
| Magnesium | 0 g | 0 g | ? |
| Zinc | 0 g | 0 g | ? |
| Copper | 0 g | 0 g | ? |
| Manganese | 0 g | 0 g | ? |
| Selenium | 0 g | 0 g | ? |
| Caffeine | 0 g | 0 g | ? |
| Fruits, vegetables and legumes | ~ 0 % | ? | ~ 0 % |
| Choline | 0 g | 0 g | ? |
Serving size
Ingredients
Ingredients image
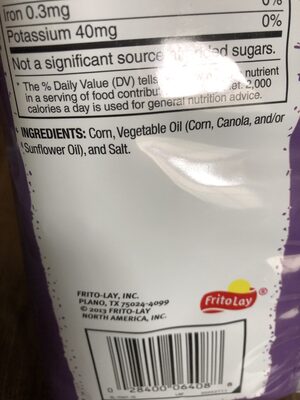
Ingredients list
Ingredient information
Ingredients analysis
No ingredients containing palm oil.
No non-vegan ingredients.
No non-vegetarian ingredients.
Food Processing
NOVA group
 Processed foods
Elements that indicate the product is in NOVA group 3
How NOVA works
Additives
Environment
Green-Score, origins bonus, and transportation impact are shown for Worldwide .
Green Score
Overall grade
 Low environmental impact
About Green-Score
Current scope
Life cycle analysis
Average impact of the category
 Corn chips or tortilla chips • Score: 83/100
Life-cycle reference
Overall environmental impact by stage (PEF)
The overall environmental impact figure (PEF) comes from ADEME's Agribalyse database, for the category: Corn chips or tortilla chips. Source: ADEME Agribalyse Database.
| Stage | Impact |
|---|---|
| Agriculture | 48.6 % |
| Processing | 14.7 % |
| Packaging | 27.3 % |
| Transportation | 7.3 % |
| Distribution | 2.1 % |
| Consumption | 0.0 % |
Bonuses and maluses
Declared origins
Packaging impact
Green-Score for this product
Green-Score for this product
Final score: 63/100Final score breakdown
Carbon footprint
Carbon footprint
Climate impact by stage (CO2e)
The carbon emission figure comes from ADEME's Agribalyse database, for the category: Corn chips or tortilla chips. Source: ADEME Agribalyse Database.
| Stage | Impact |
|---|---|
| Agriculture | 32.4 % |
| Processing | 10.0 % |
| Packaging | 46.8 % |
| Transportation | 9.9 % |
| Distribution | 1.2 % |
| Consumption | 0.0 % |
Packaging
Packaging impact
Data precision
Transportation
Declared origins
Forest footprint
Forest footprint
Deforestation risk details
Data Source
Product data comes from Open Food Facts. Food Benchmark also adds translations, category comparisons and explanatory calculations.
The database is licensed under ODbL 1.0, individual contents under DbCL 1.0, and product photos under CC BY-SA 3.0.
Product added on June 10, 2018 at 9:43:02 AM UTC by kiliweb .
Last edit on May 28, 2026 at 8:35:22 PM UTC by municorn-calorie-counter-app .
Product page also edited by foodless, gavingt, hvalley, inf, kiliweb, municorn-calorie-counter-app, openfoodfacts-contributors, org-database-usda, prepperapp, roboto-app, yuka.SDVrcUFiWWw5dFE2bHNJbjR4TFozTWx6M3FDcllYK3hHOW9MSVE9PQ.
Source List
- database-usda